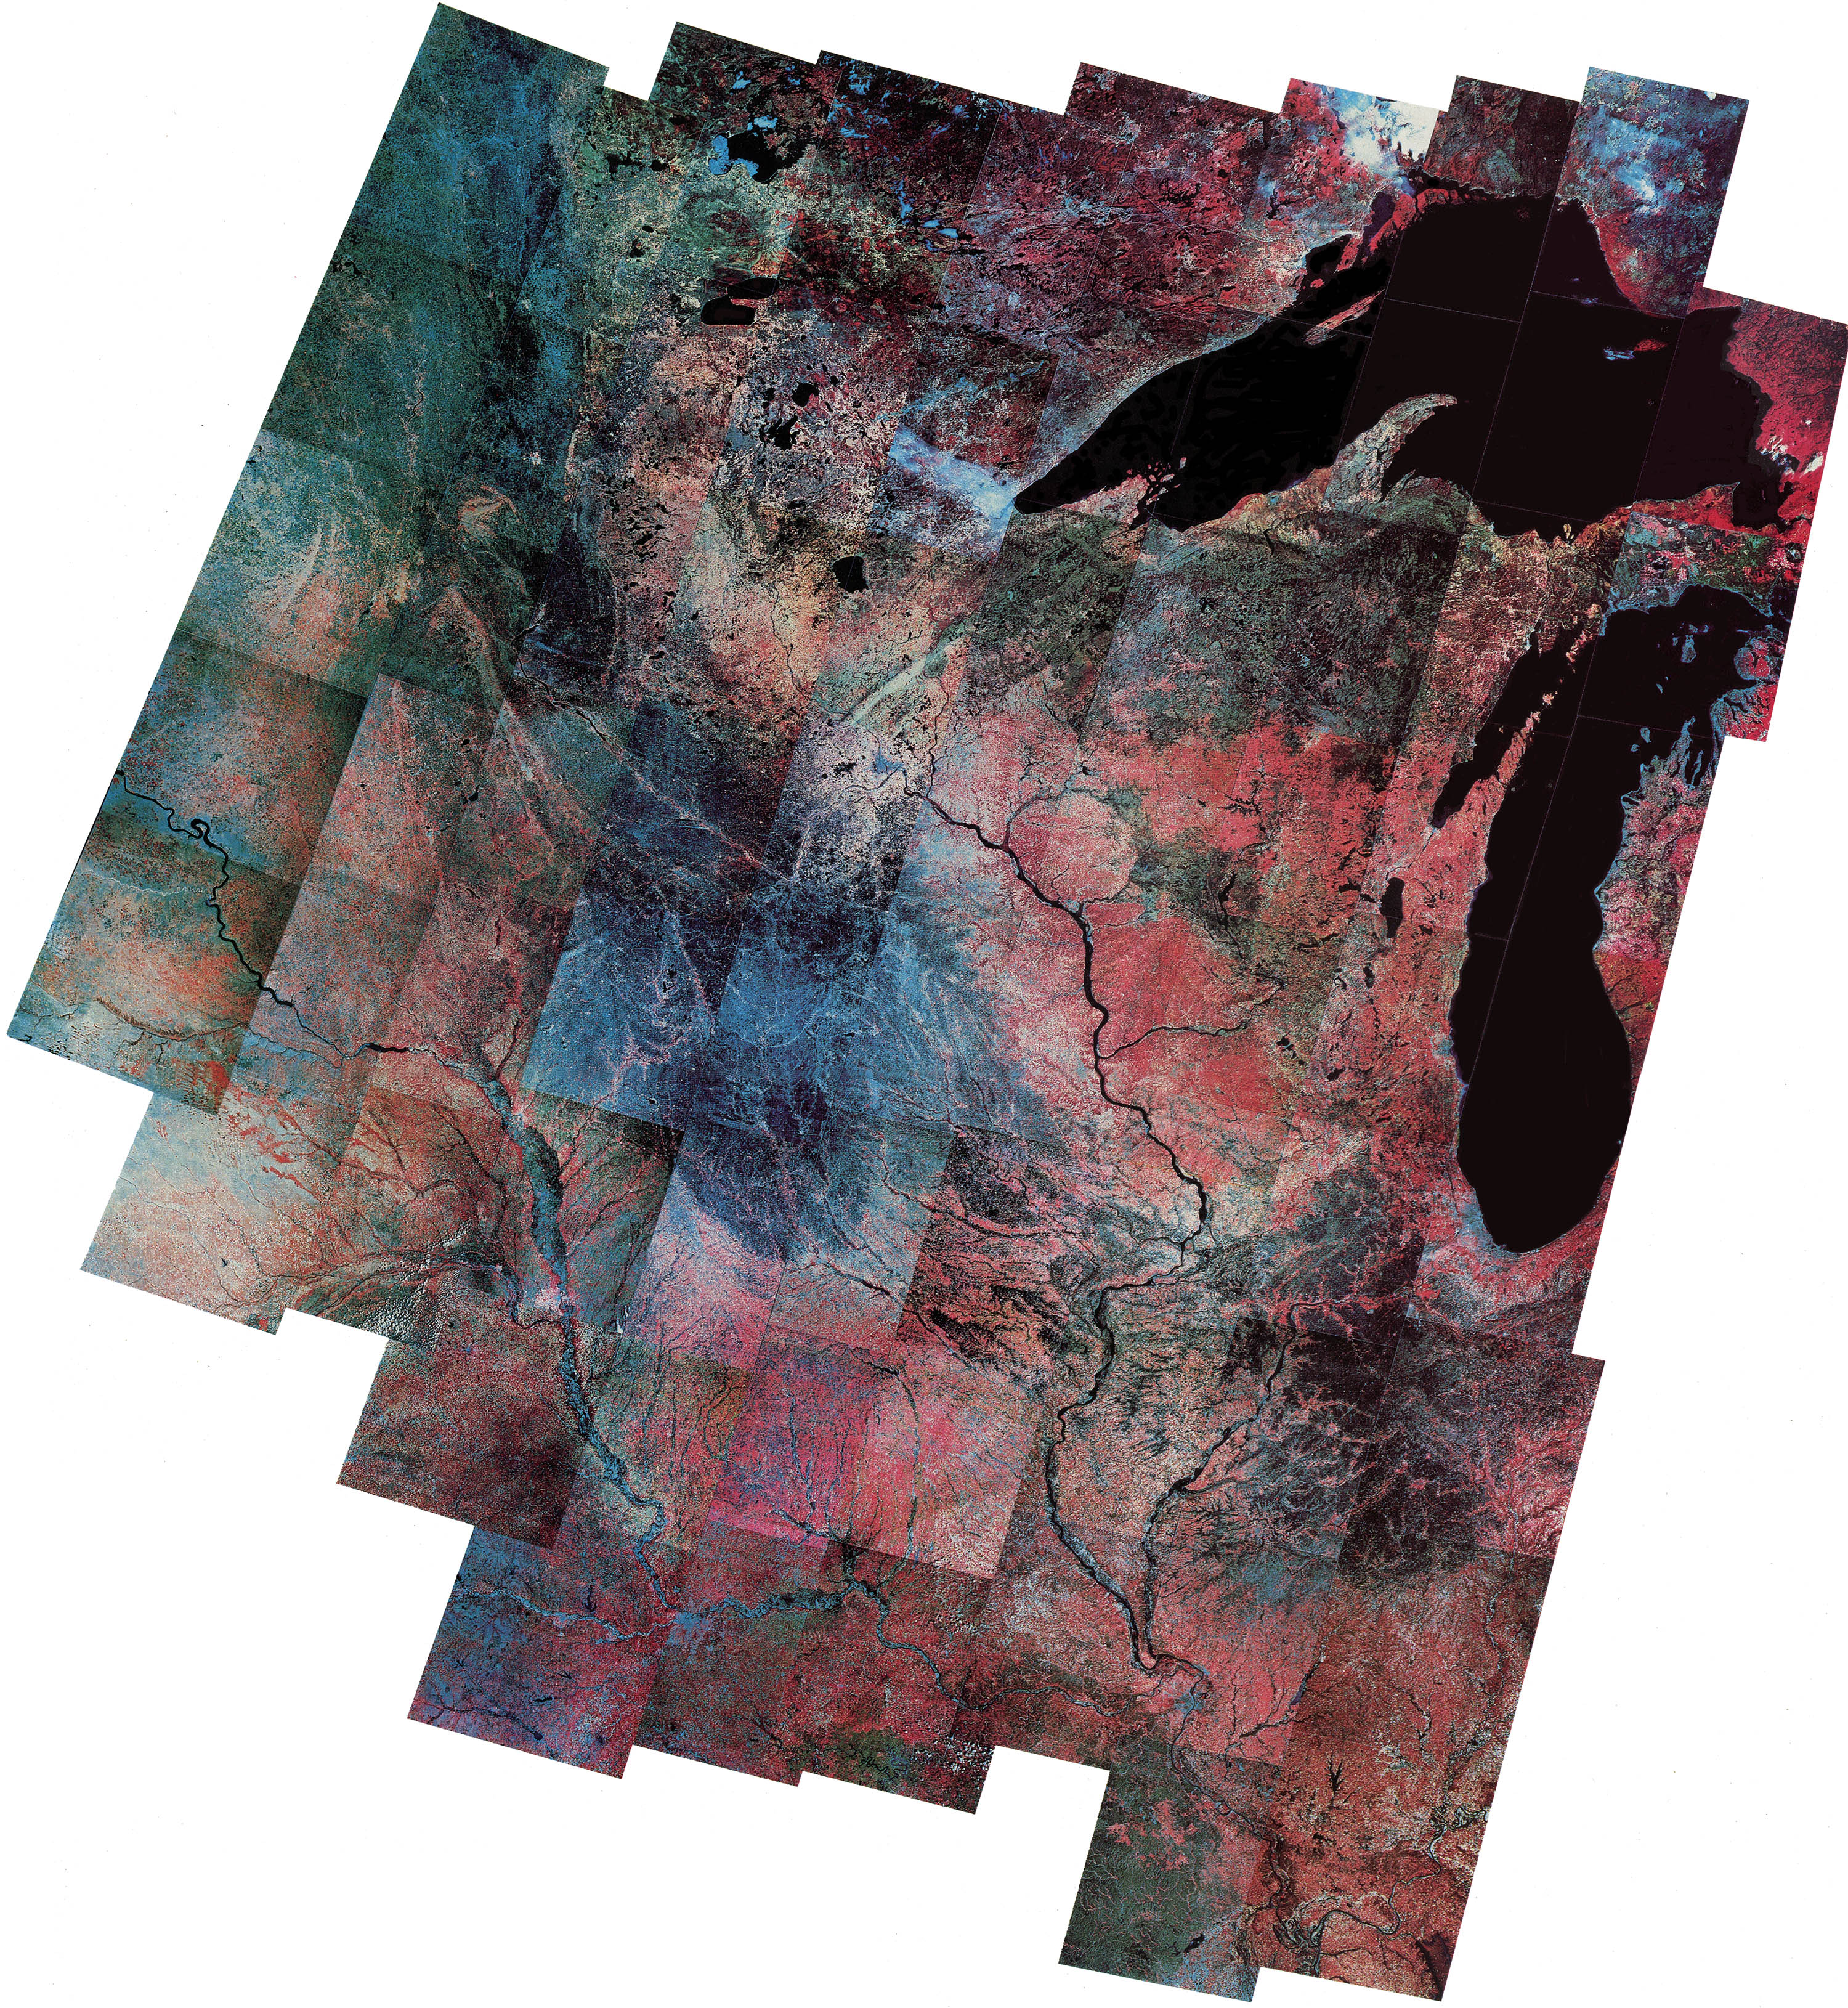
Detail, the Northern Heartland. from ref. 1
103
Landsat
The Satellite Map
This patchwork mosaic shows, roughly, Minnesota, the UP, Wisconsin, Illinois and Iowa. The 75 hand-laid images represent 10 consecutive composite paths of Landsat 1 and 2 and were taken during Apr, May and Jun between 1973–78.1 In other words – springtime on the prairie. No one is going to confuse this with a 50cm Google Map, but it was this image and millions more like it that revolutionized Earth Sciences, including for our purposes, cartography.
A civilian terrestrial remote-sensing satellite was proposed in 1965 by William Pecora, director of the USGS. By 1967 NASA, in response to pressure from the DOI, began planning a small unmanned satellite and after several more years of political infighting Congress gave NASA the funding for the project. In just two years they designed, built and launched the Earth Resources Technology Satellite (or ERTS in bureaucratic acronym-speak; the program was renamed Landsat in 1976).
Within just days of the 23 Jul 1972 launch2 the ERTS was returning stunningly useful data.3 Soon geologists were using the images to discover sedimentary uranium deposits in Wyoming; hydrologists were determining the rate of snow melt in the Wind River Mountains; oceanographers were detecting plankton distributions off the coast of Western Sahara and agronomists were identifying vegetation in the Sahel. We could go on all day like this but I think you get the idea. Here is the first identifiable ERTS image, from 25 Jul 1972:
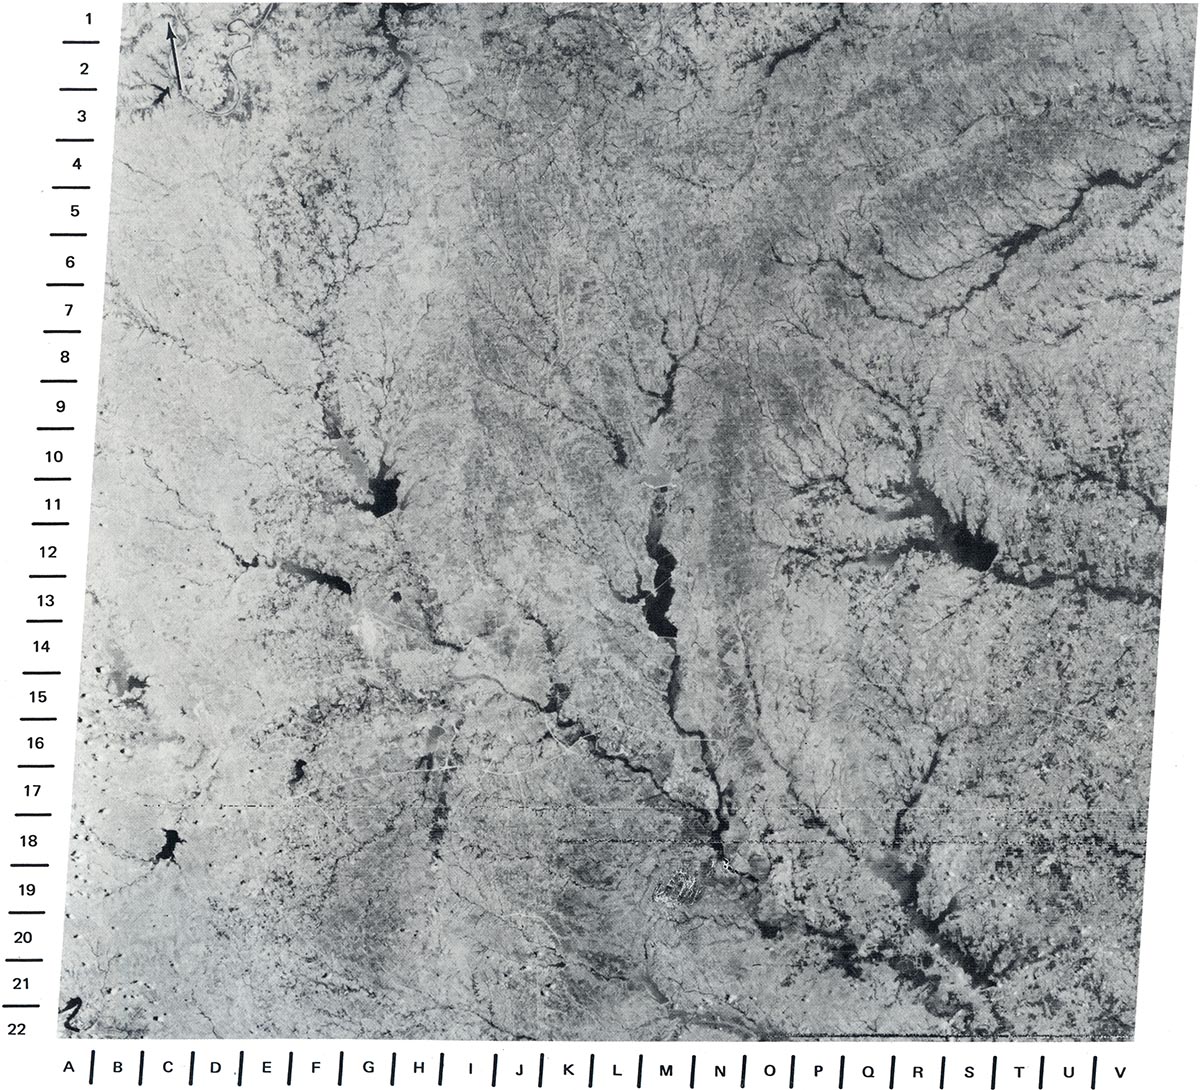
Dallas (I–14) – Ft. Worth. 25 Jul 1972. From ref. 4
And here are a few more early images of interest:
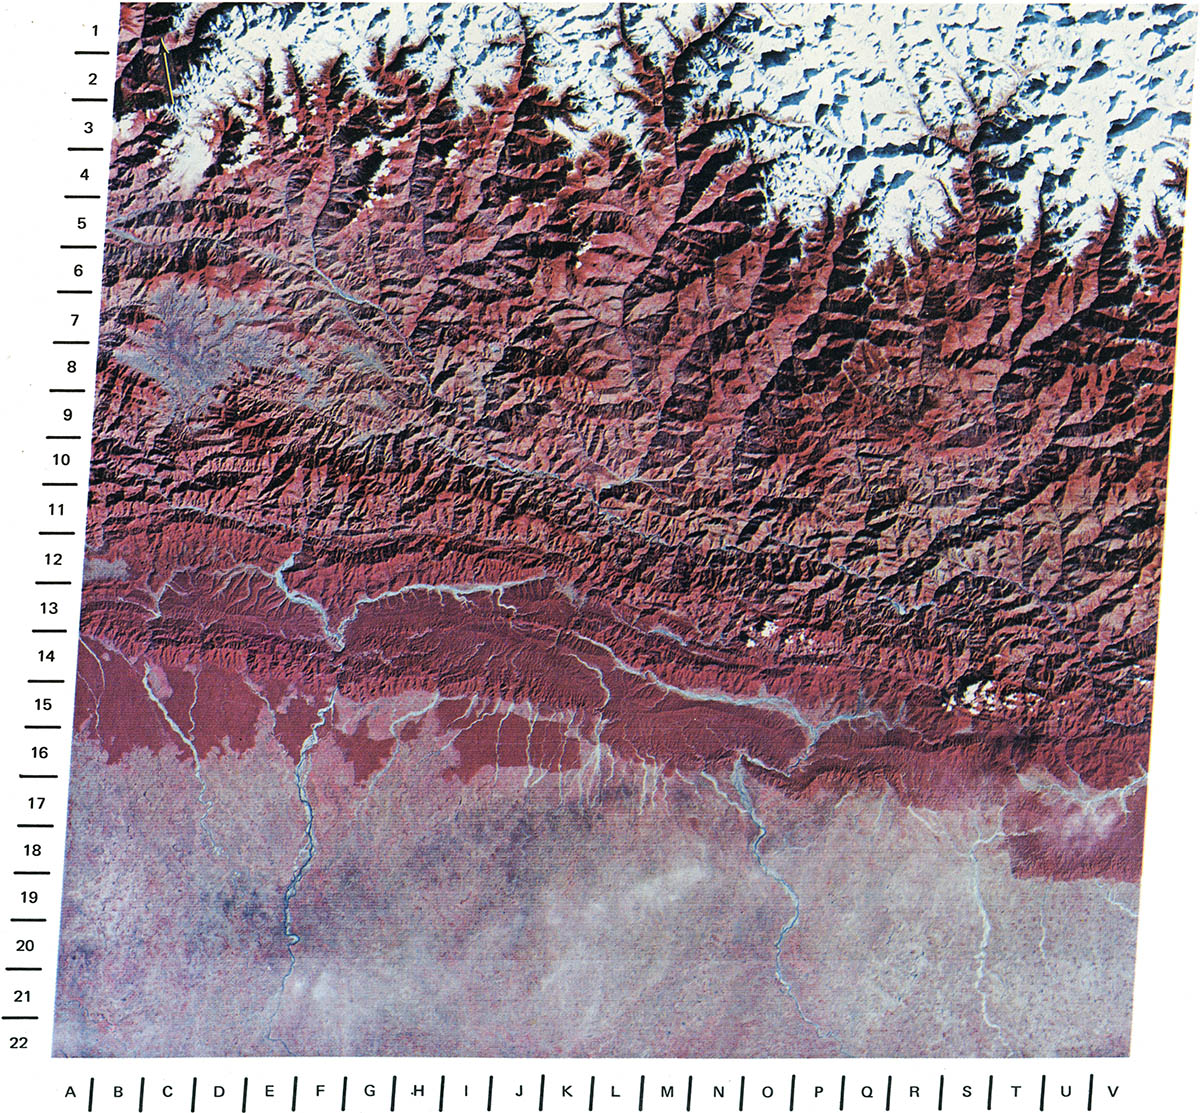
India-Nepal. Mt. Everest is located at T–1. 14 Dec 1972. From ref. 4
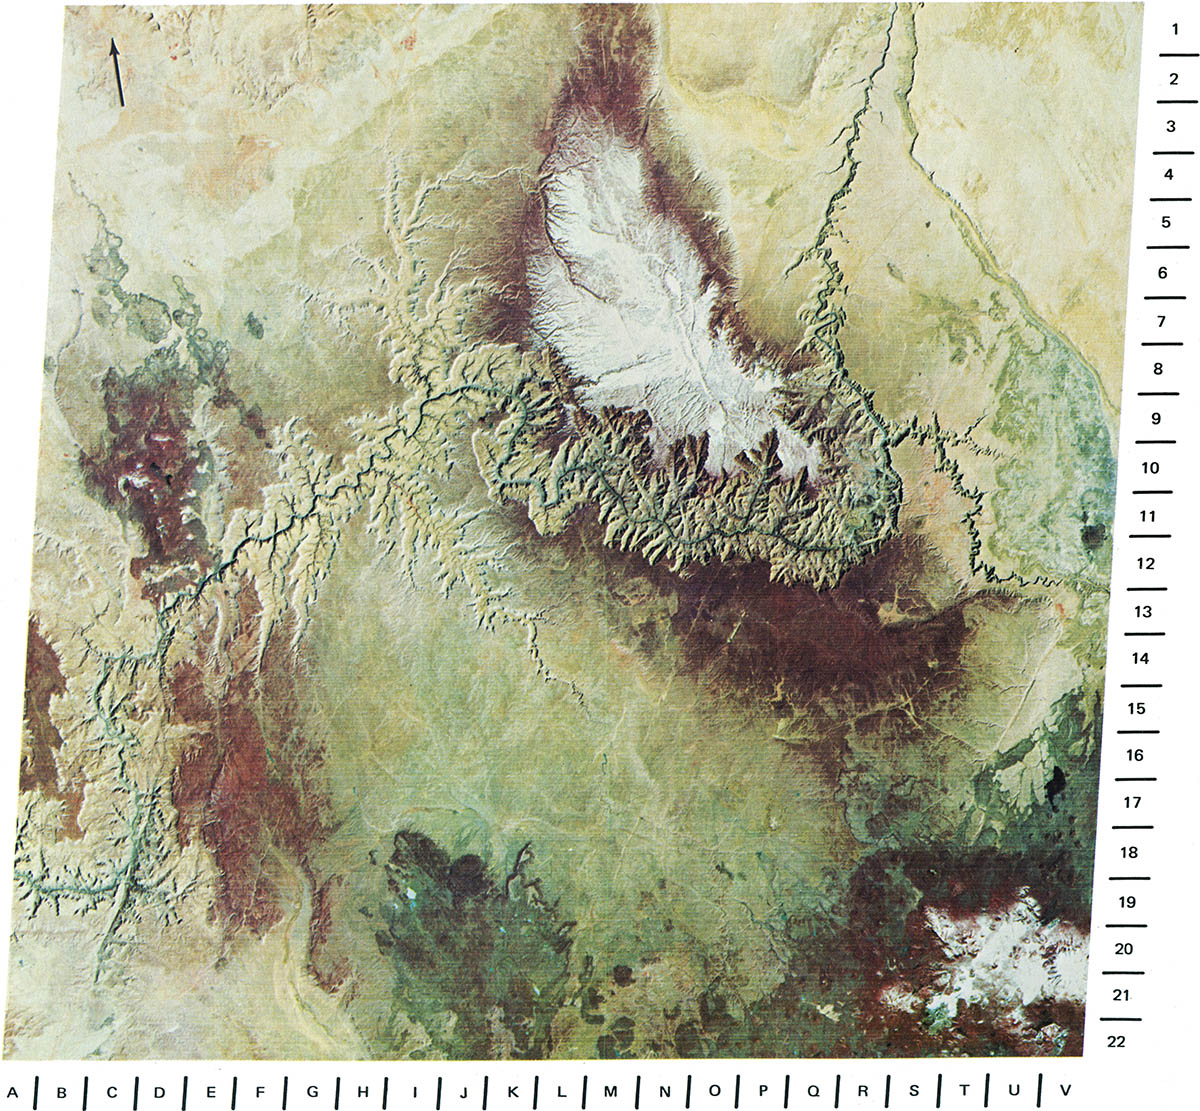
The Grand Canyon, 3 May 1973. From ref. 4
In one fell swoop the ERTS radically changed traditional cartography. As Dr. Paul D. Lowman remarked, “Our first discovery from ERTS is that all our maps, topographic as well as geographic, are out of date.” To prove his point he prepared this map from an image taken on 25 Jul 1972. It included some 30 previously unknown geologic lineaments:
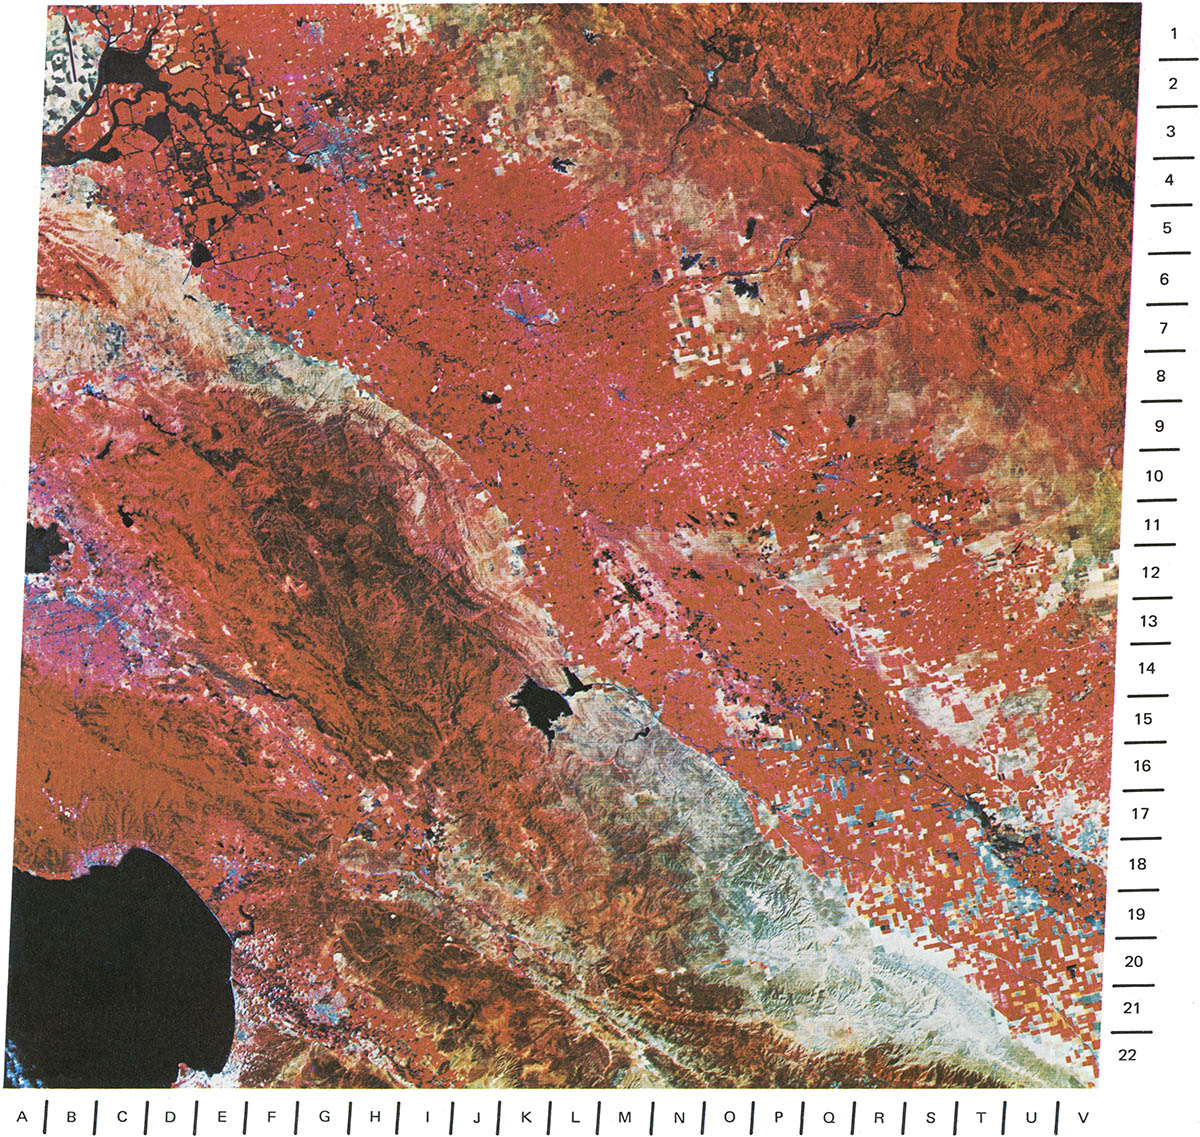
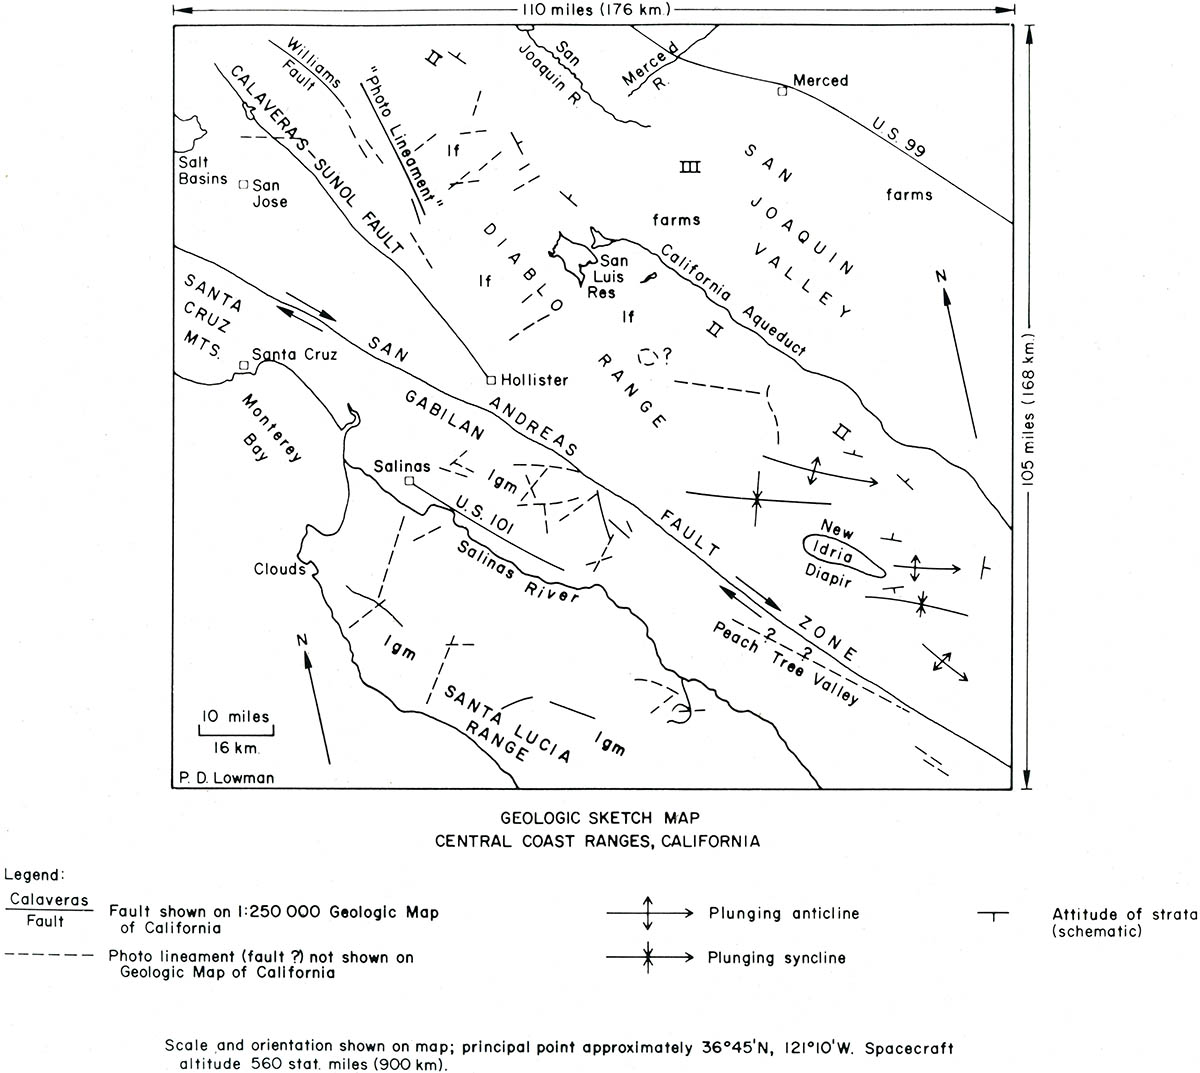
Geology of Central California. 1972. From ref. 4
Cartographers began to see the Landsat images not as a means to correct previous maps but as maps in and of themselves. Eventually there were enough cloud-free images available to create large-scale mosaics, such as this map of Wyoming, prepared from 27 individual images:
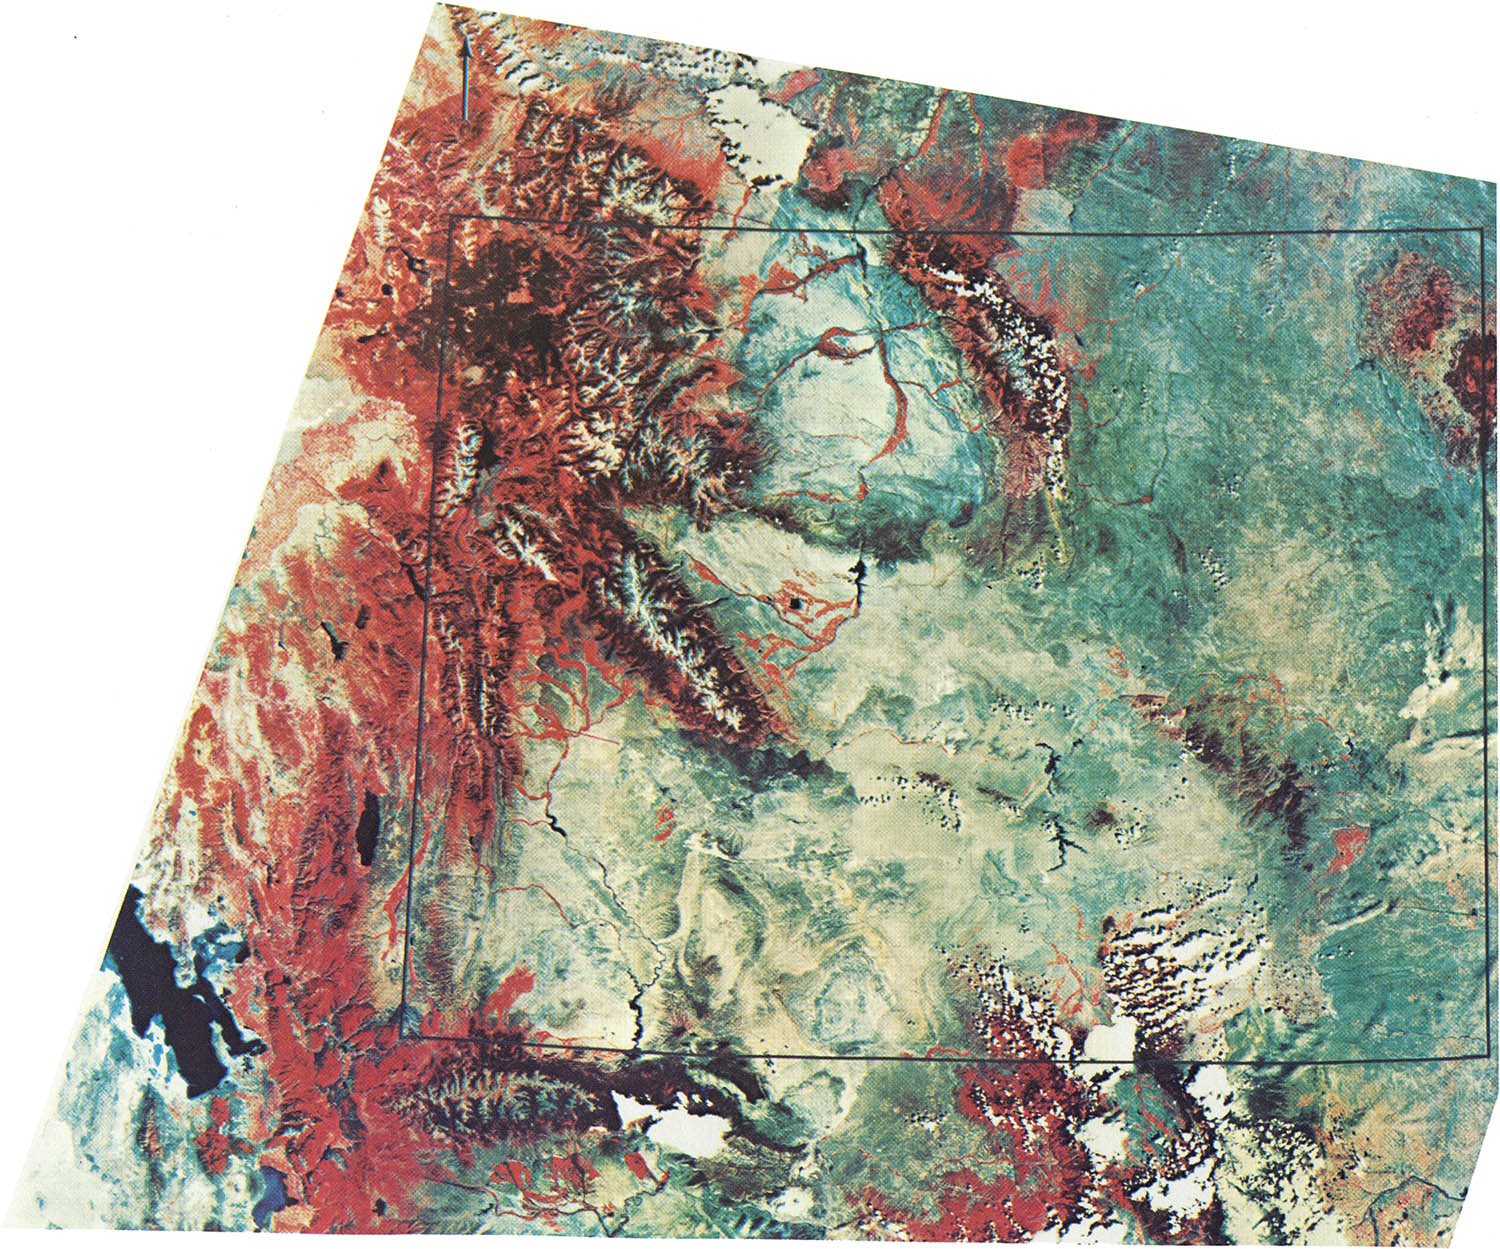
Wyoming Mosaic, 1972. From ref. 4
Or this mosaic prepared for the Iranian government:
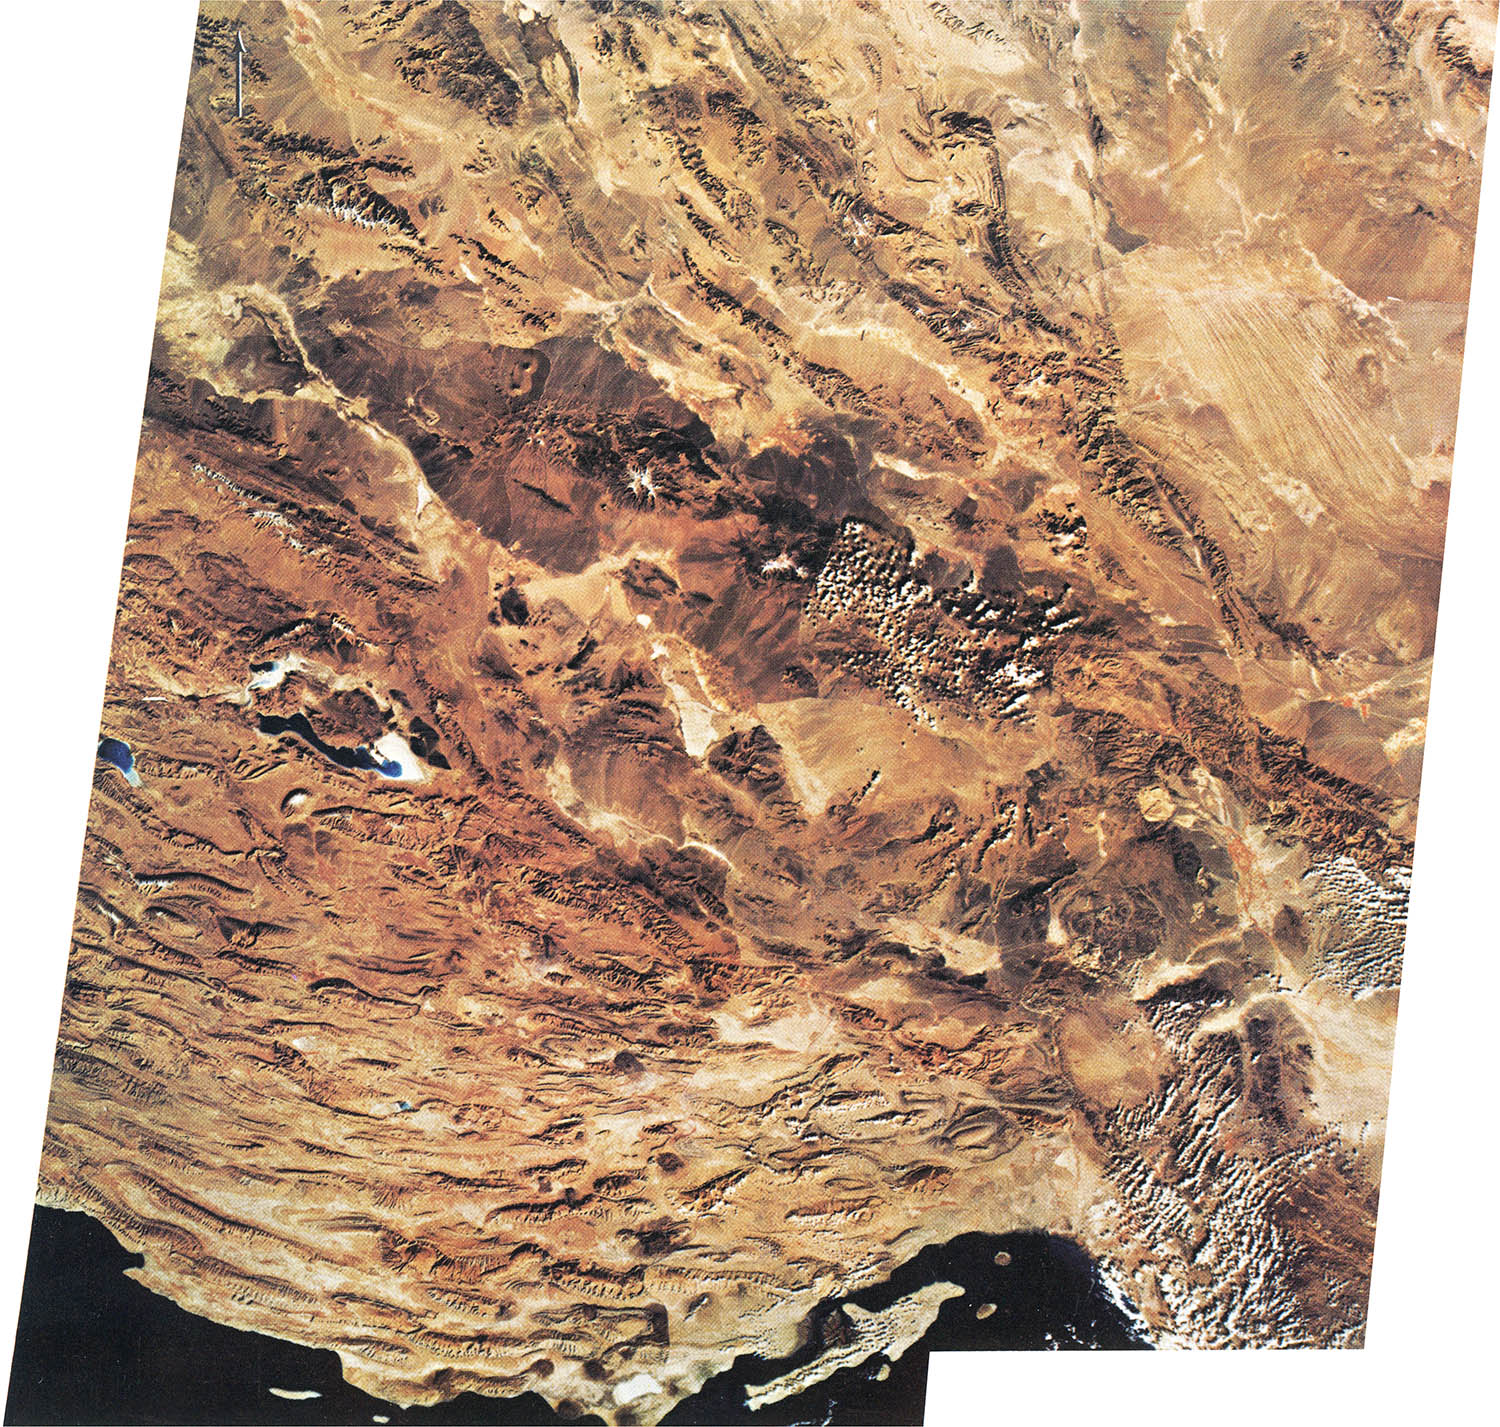
Southern Iran. From ref. 4
In 1973 Dr Nicholas Short of the Goddard Space Flight Center proposed a much more ambitious mosaic – a map of the entire US.5 Using 595 band 5 (red) and 7 (infrared) images taken between 25 Jul–1 Nov 1972 the DOA Soil Conservation Service’s Aerial photo lab prepared this B&W mosaic in 1974:
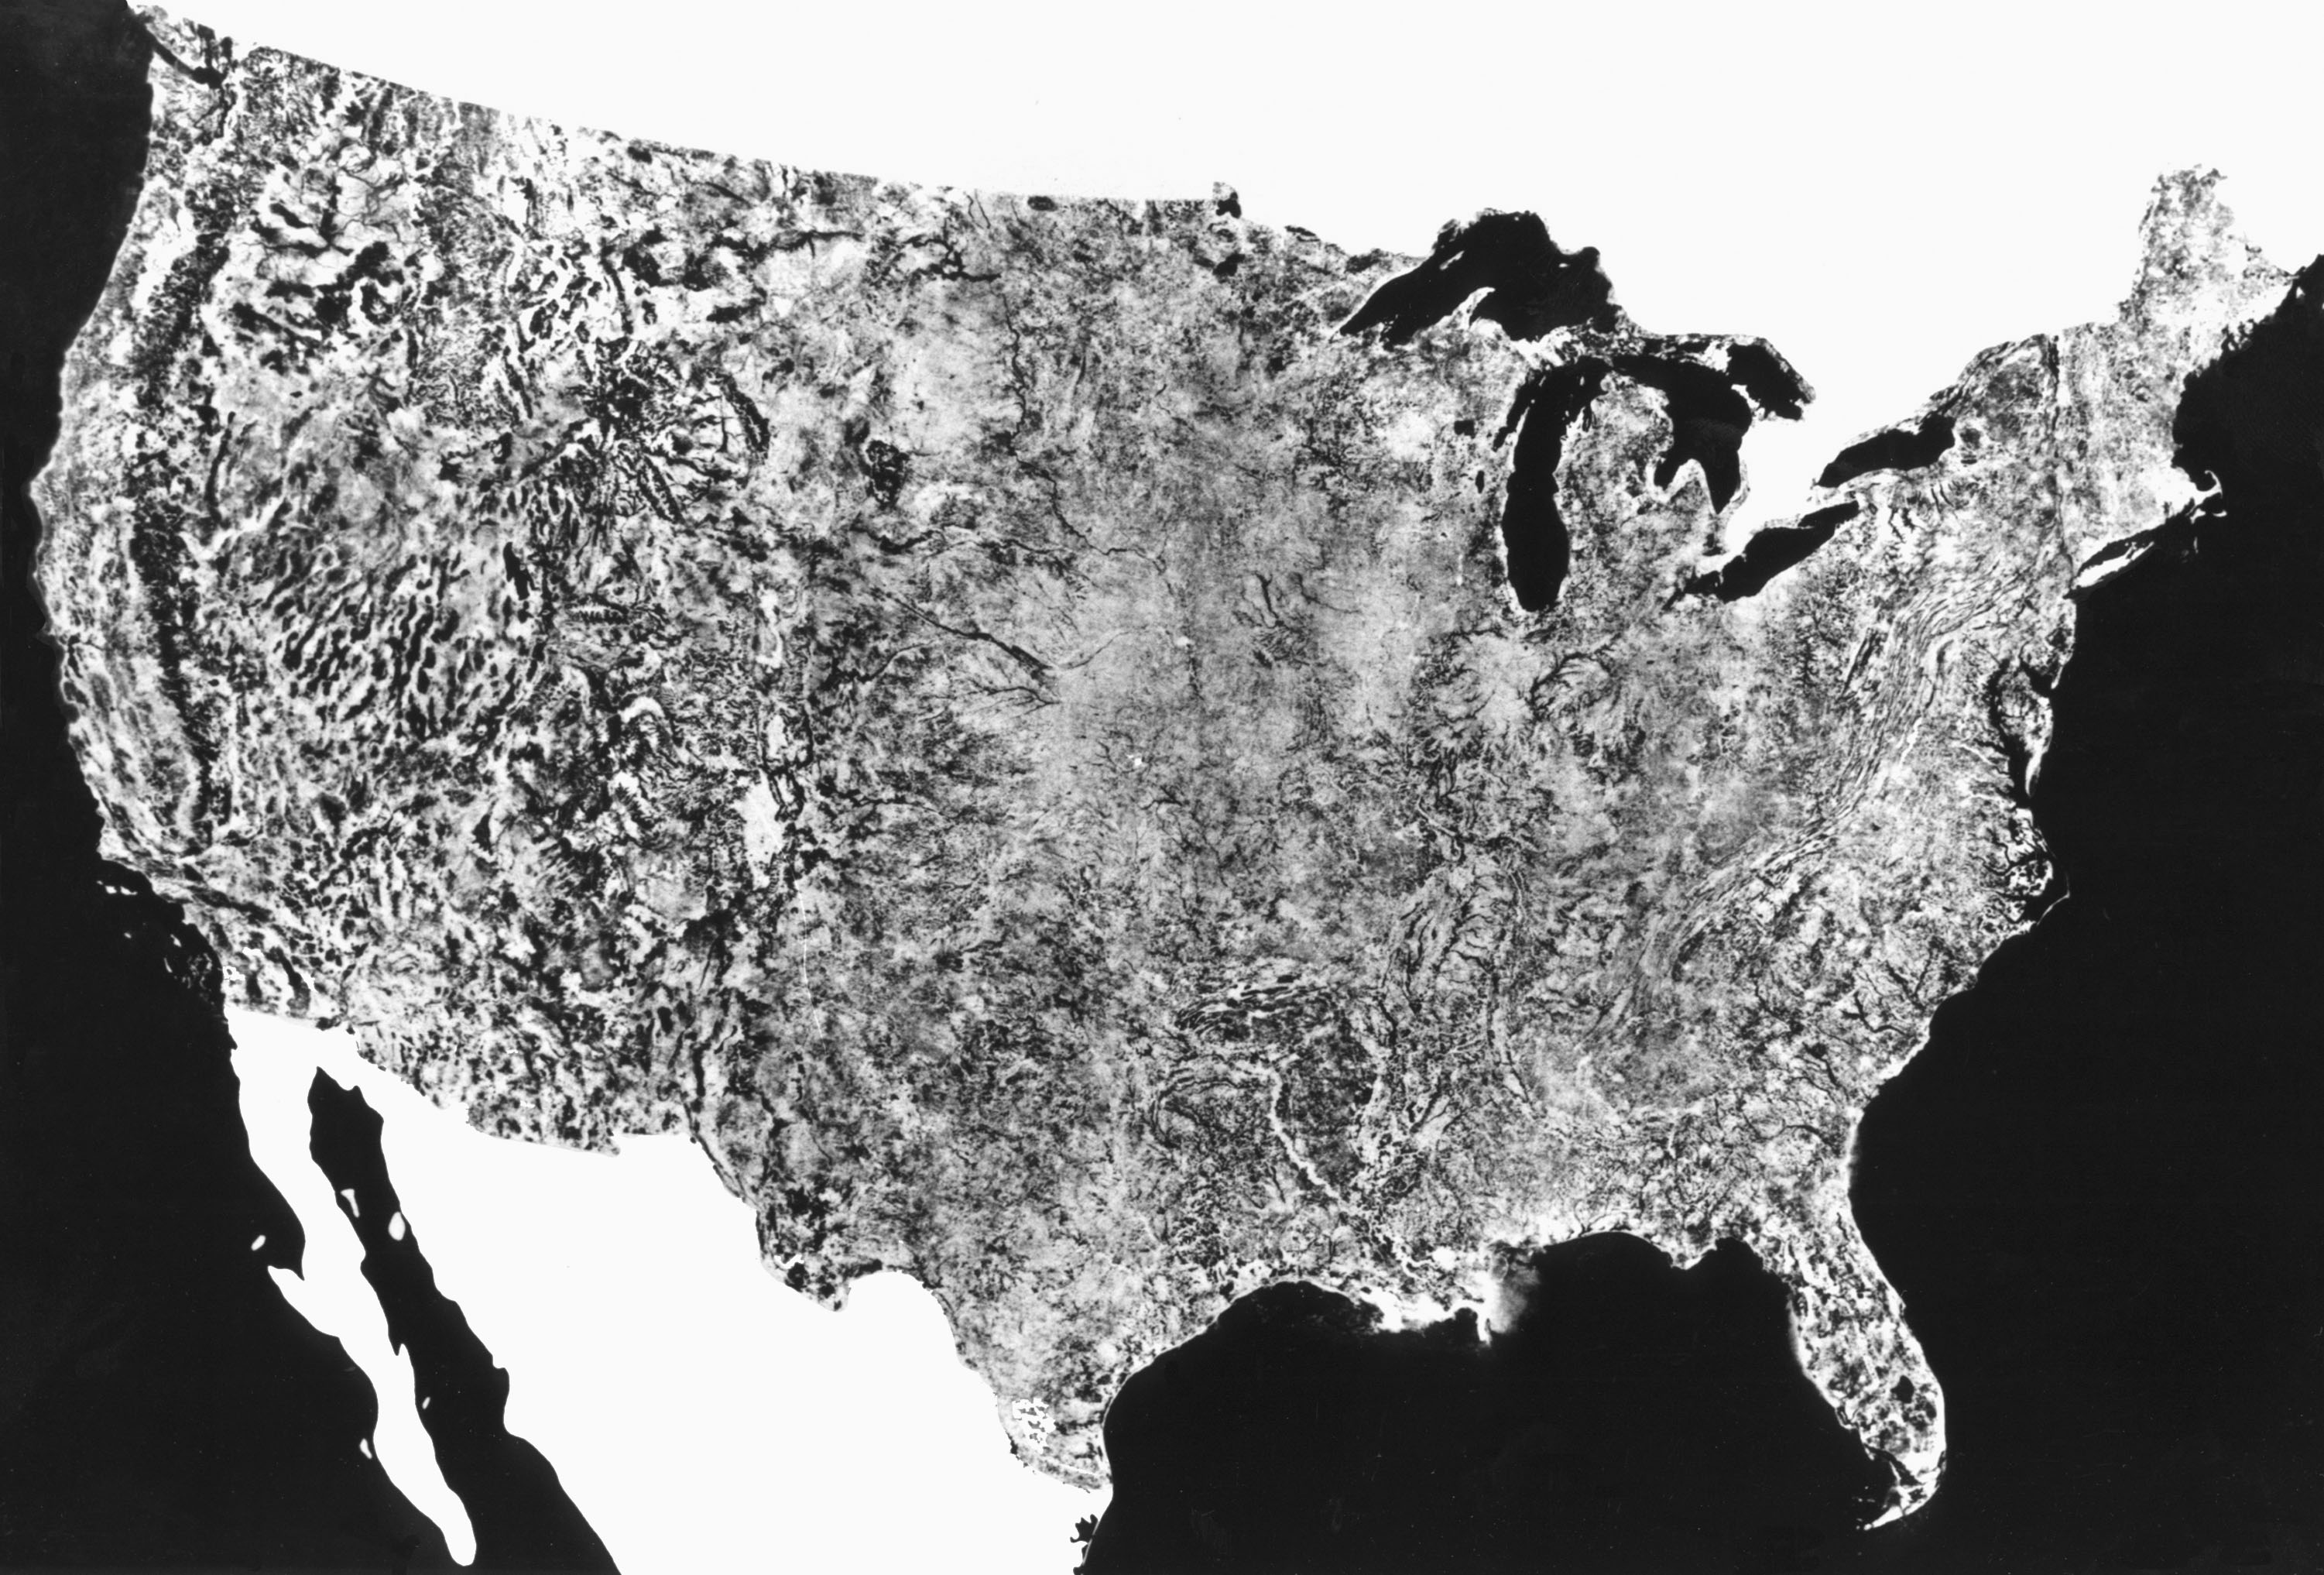
NASA 74-H-275
The map caused something of a sensation when it was unveiled. Soon the National Geographic Society commissioned NASA to make a color version in time for the US Bicentennial.
NASA contracted General Electric’s Space Sciences Image Lab to prepare the map. Lab director Tony Rossi and his team sifted through more than 30,000 images taken during Spring, Summer or Fall between 1972–75 and finally selected some 700 images. It took more than four months to color match, rephotograph, assemble and and blend the 569 individual images into a seamless mosaic. The resulting 10 × 16 foot map would become one the most iconic of the US ever prepared.5
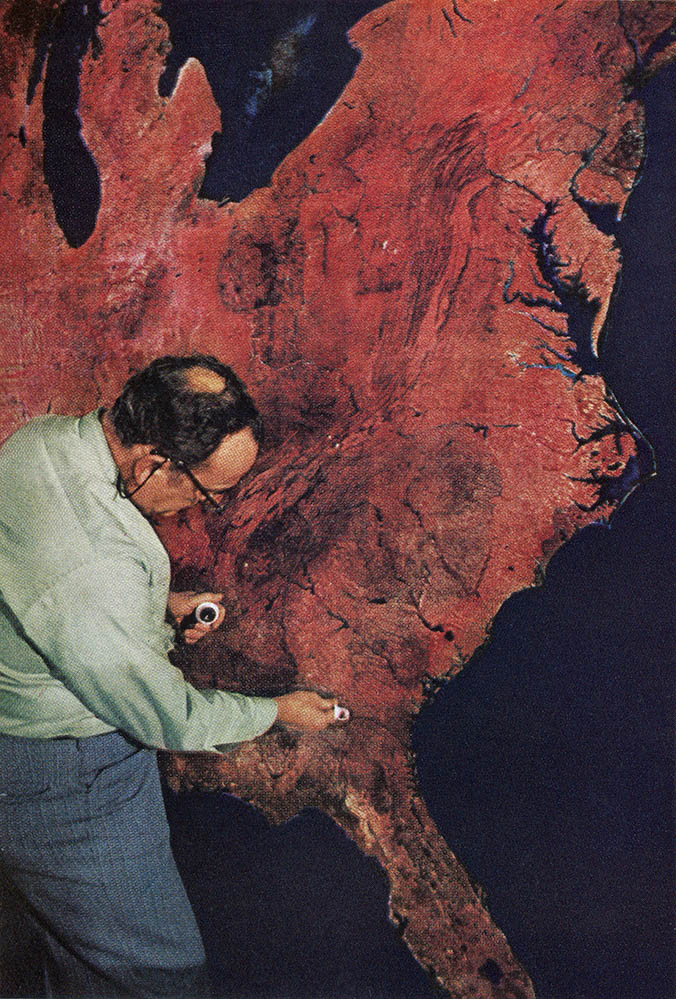
Tony Rossi working on the original map. From ref. x
The NGS took the GE mosaic and filtered each band to create a less false-colored image. The map was included as a supplement to the Jul 1976 Bicentennial issue of National Geographic:
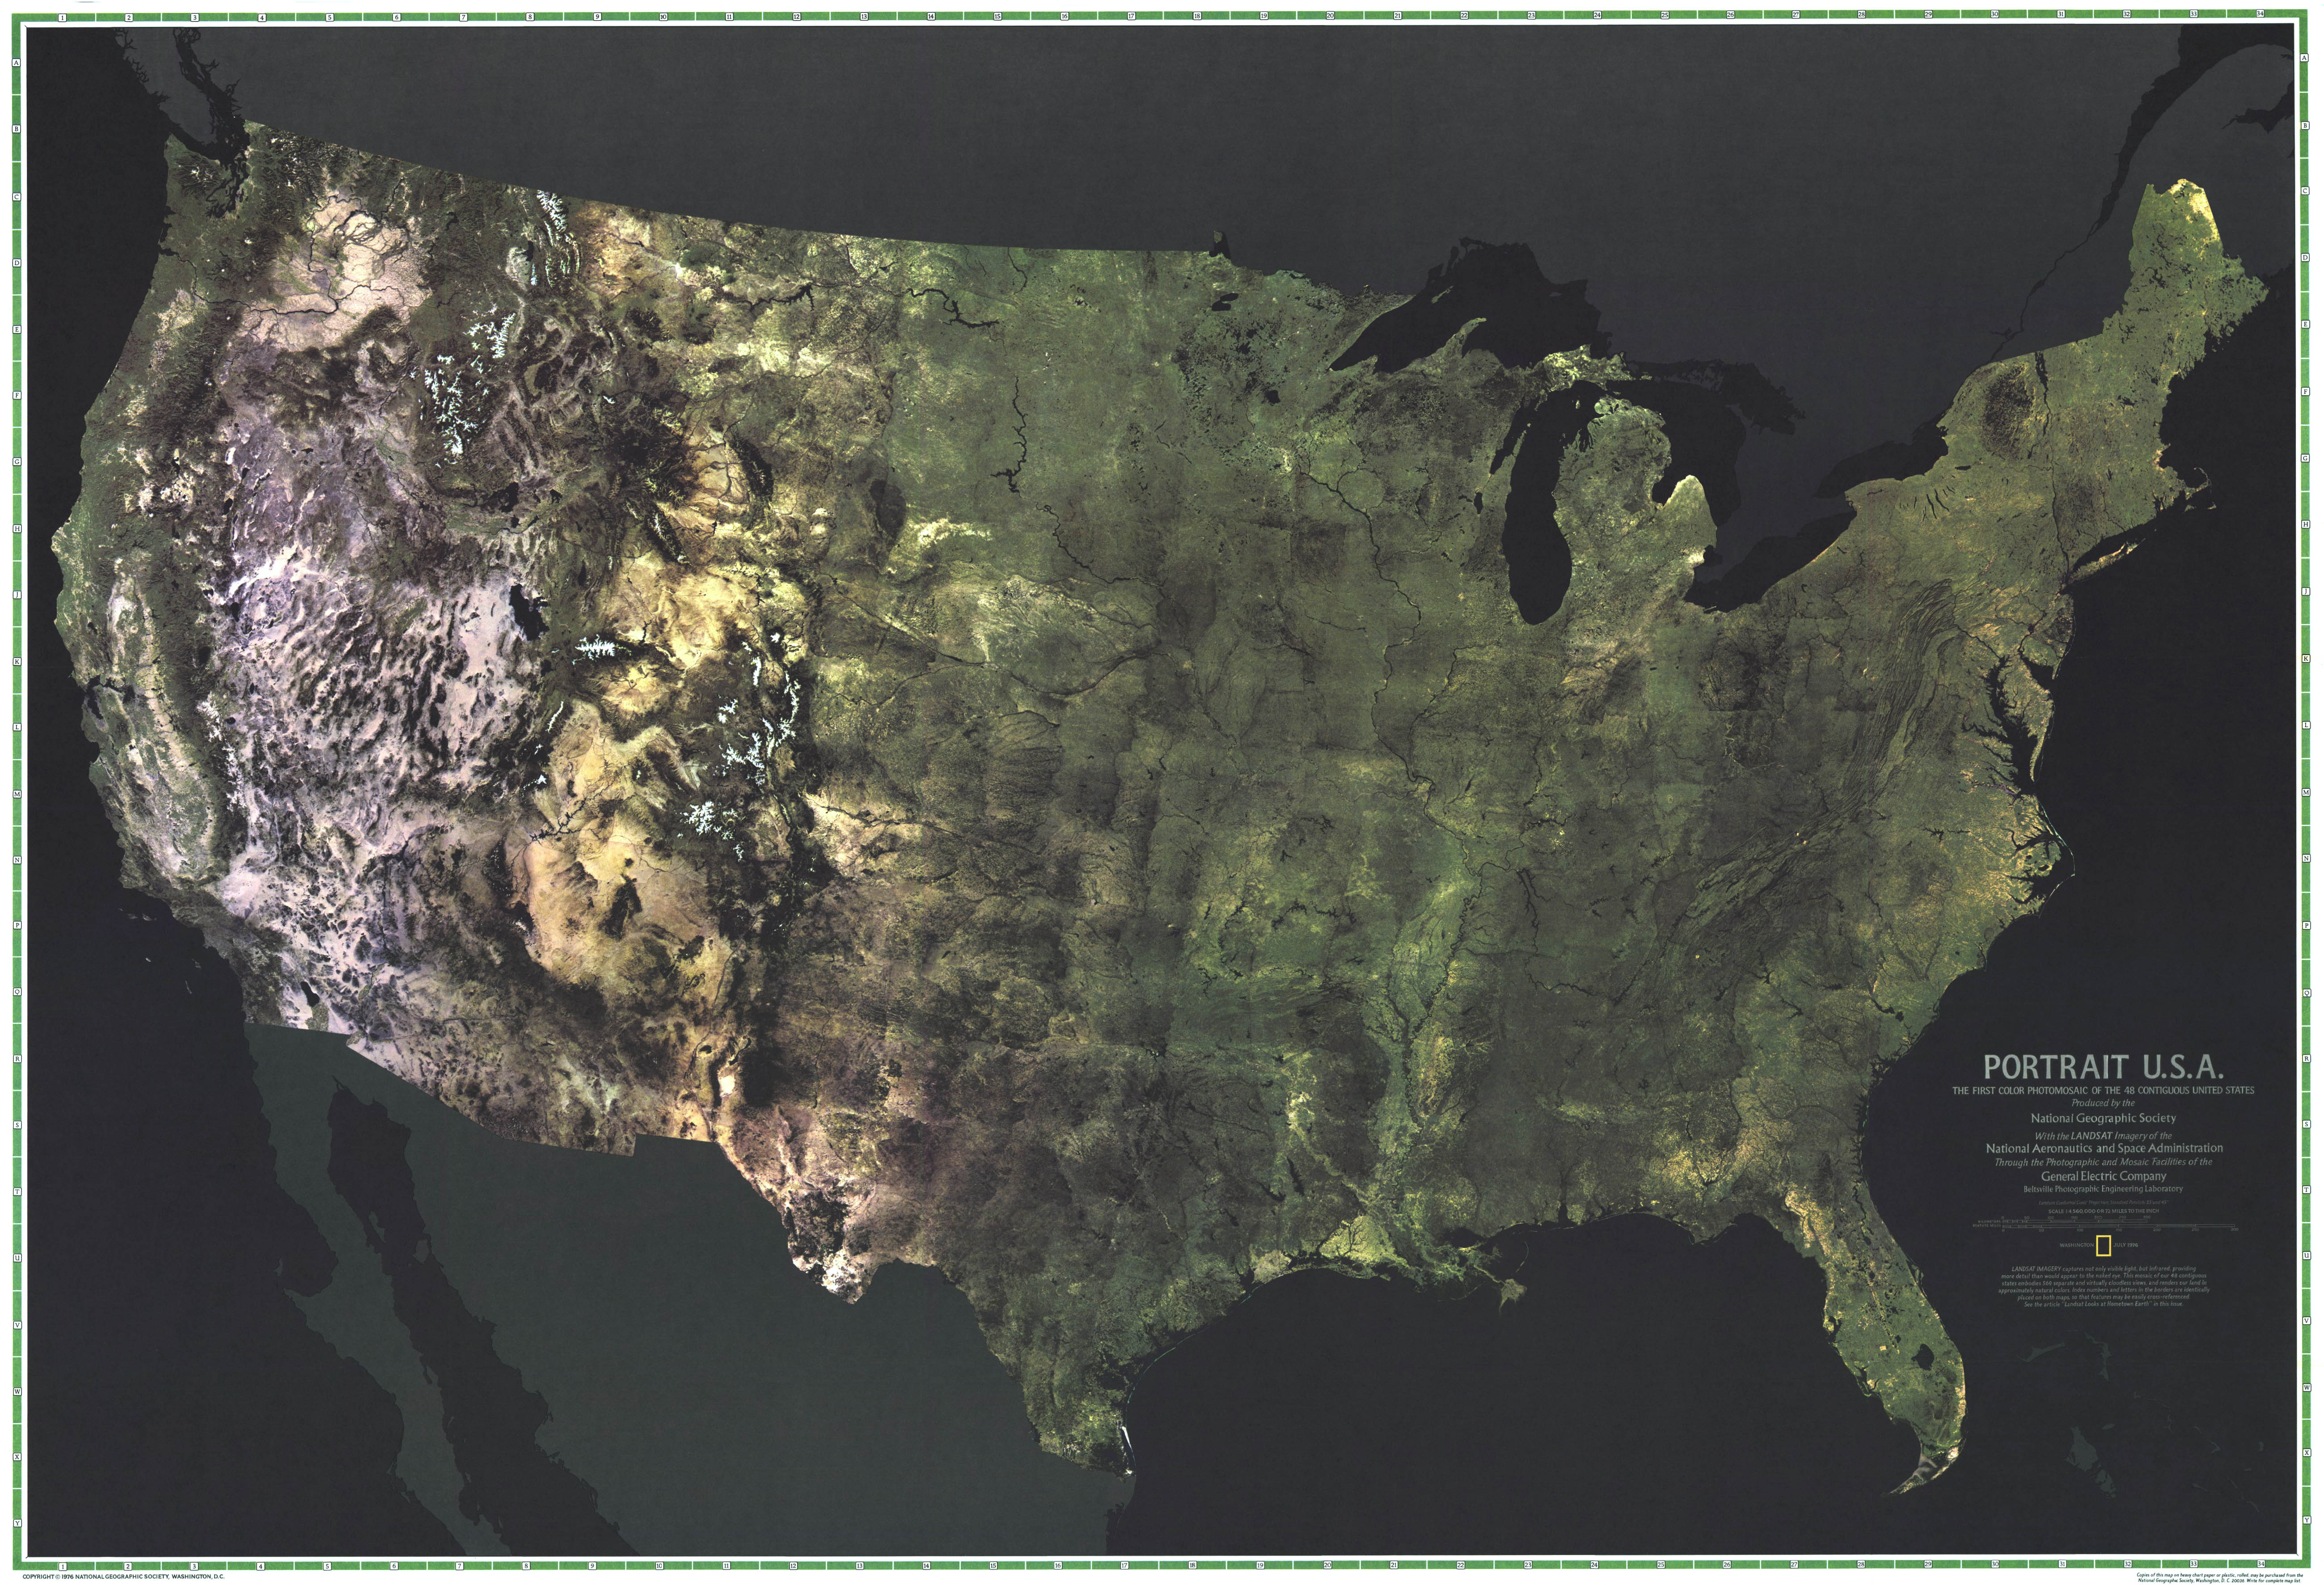
Portrait U.S.A., 1976
Over the last 40 years the Landsat program has produced more than 2.5 million images and Landsat 5 and 7, still orbiting, generate more than 400 images a day.8 More sophisticated sensors as well as increased computing power has led to even more detailed maps, such as this example, a mosaic of Landsat 4 and 5, (band 2,4 and 7) images:
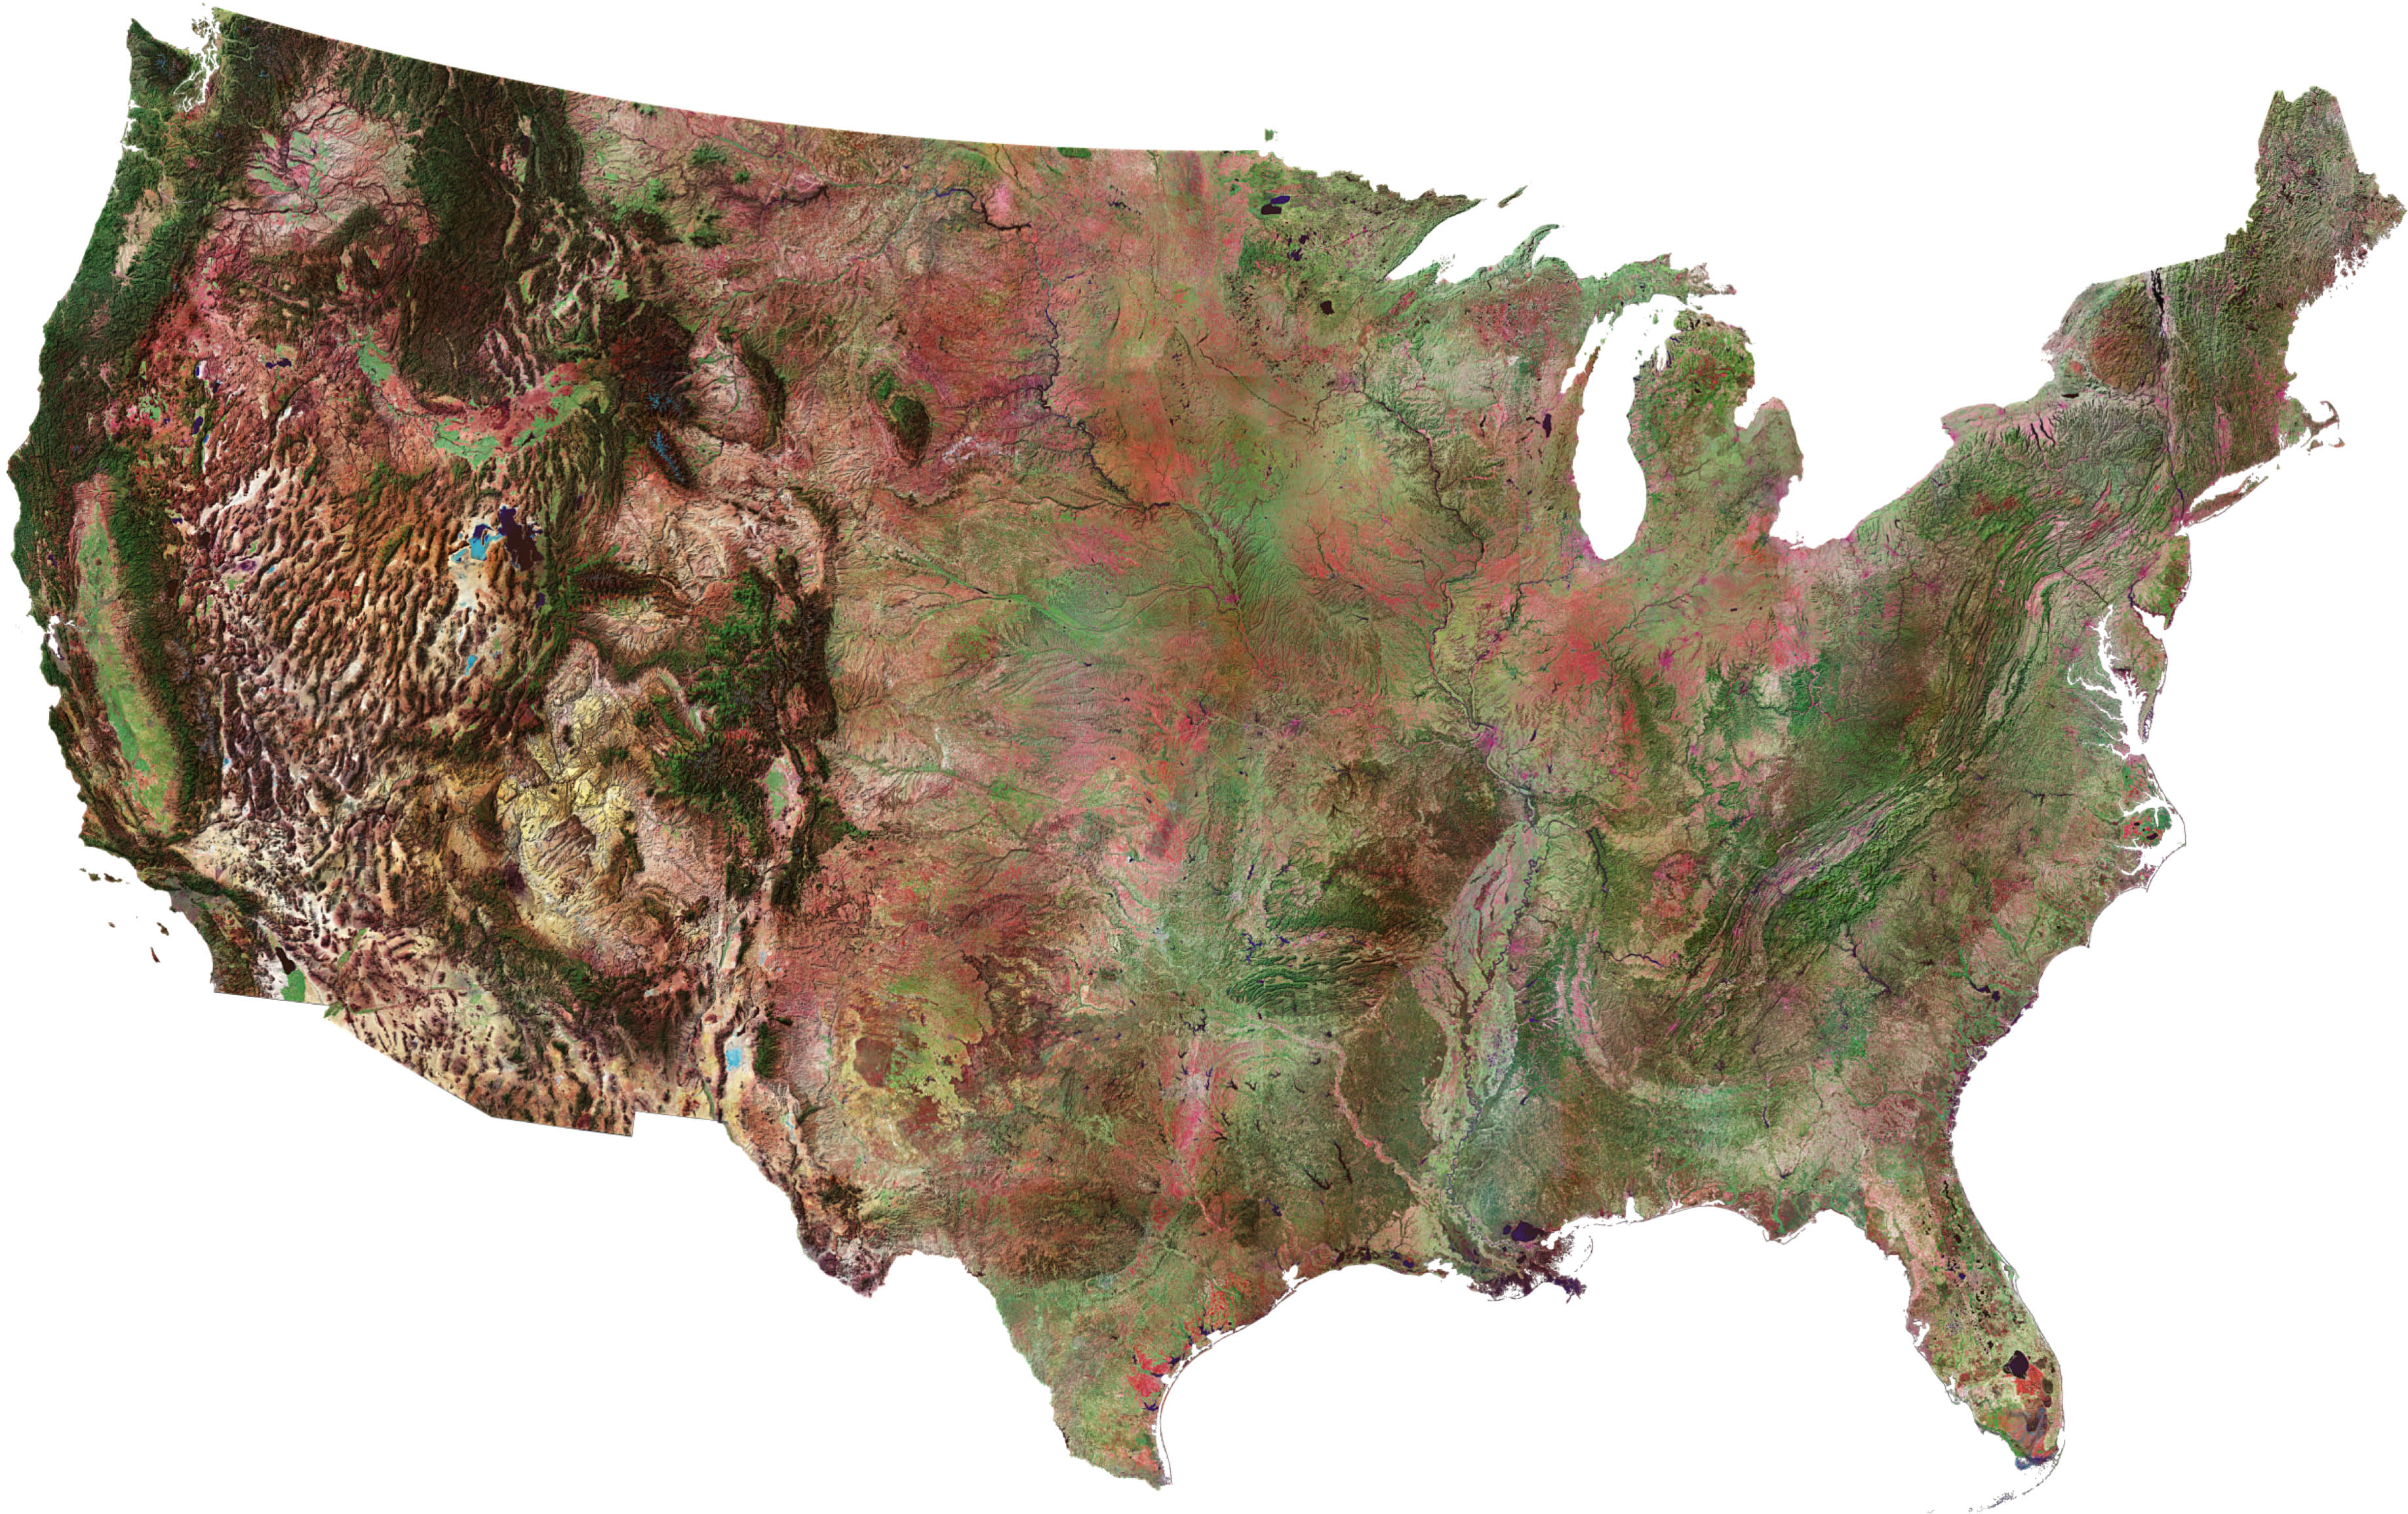
The Conterminous United States. National Atlas
1. Atlas of North America. Washington D. C.: National Geographic Society, 1985.
2. IYI: ERTS-1 was launched via a Delta 100 rocket on 23 Jul 1972 from Vandenberg AFB. The 816 kg satellite was placed into a near-polar (sun-synchronous) orbit [perigee 895 km, apogee 908 km, inclination 99.4°]. It orbited the Earth every 99 min and repeated coverage every 18 days. The mission was terminated on 6 Jan 1978.
3. NASA and the USGS planned to use a return-beam vidicon (RBV), which were successful in previous Nimbus weather satellites, as the main sensor but in a last minute unsolicited bid the upstart Virginia Norwood of Hughes Aircraft proposed a multispectral scanner (MSS). To suggest that NASA was skeptical was an understatement – after all the untested MSS included a moving part (in this case a mirror that oscillated 13 times/s) and they were sure it would fail. In a classic case of bureaucratic indecision both sensors were installed on the ERTS.
In a sweetly ironic turn of events the RBV malfunctioned with “unexplained electrical problems” just hours into the mission and was eventually turned off. The MSS, on the other hand, operated perfectly for the next 5+ years.
The MSS captured light in four different spectral bands – band 4 (0.5–0.6 µm, blue), band 5 (0.6–0.7 µm, red), band 6 (0.7–0.8 µm, infrared) and band 7 (0.8–1.1 µm, infrared) – which accounts for the characteristic red/blue false color image.
4. Short, Nicholas, Lowman, Paul, et. al. Mission To Earth: Landsat Views the World. Washington, D.C.; NASA, 1976 (NASA SP–360). This oversized "coffee-table" book included 400 plates, which are online at the NASA Astrophysics Data System.
The principal author, Dr. Short, was a geologist by training and became an expert in remote sensing, He writes expansively about his career, including the book, here. After his retirement he began the decidedly web 1.0, but completely awesome Remote Sensing Tutorial. He died 12 Jun 2011, but NASA, to their credit, still hosts the site.
5. Short, N. M., Lowman, P. D. Earth observations from space: Outlook for the geological sciences. NASA Report X-650-73-316. Washington, D.C: NASA, Oct 1973.
6. To the late Baby-Boomer/early Gen-X hipster (such as your humble narrator) this map is probably best known as the back cover of the Talking Heads’ More Songs About Buildings and Food (Sire, 1978):
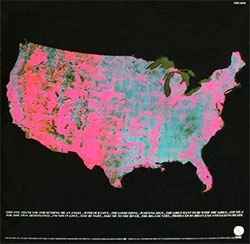
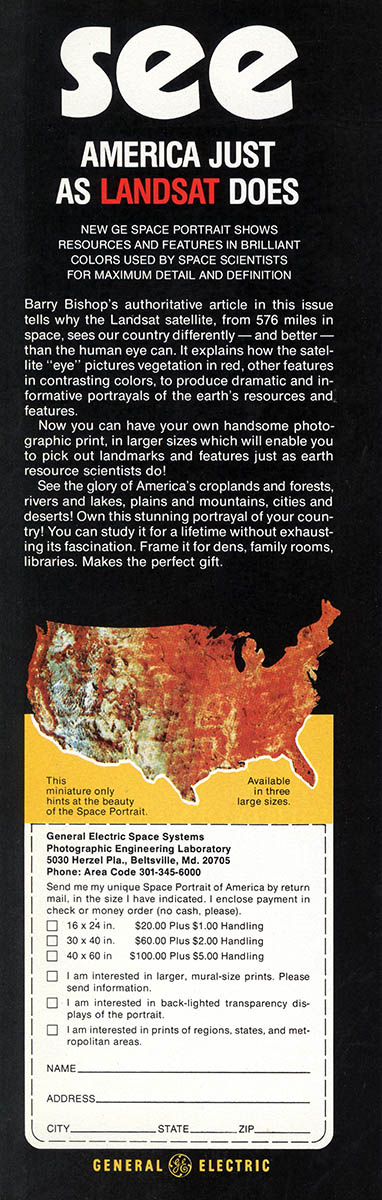
7. Bishop, Barry. “Landsat Looks at Hometown Earth.” National Geographic. Jul 1976 Vol. 150, No. 21; 140–147. If the map supplement wasn’t good enough for you GE also advertised “photographic prints” in the same issue:
8. For a nearly real-time Landsat 5 or 7 video feed see the USGS’ EarthNow! site.
26 Sep 2011 ‧ Cartography