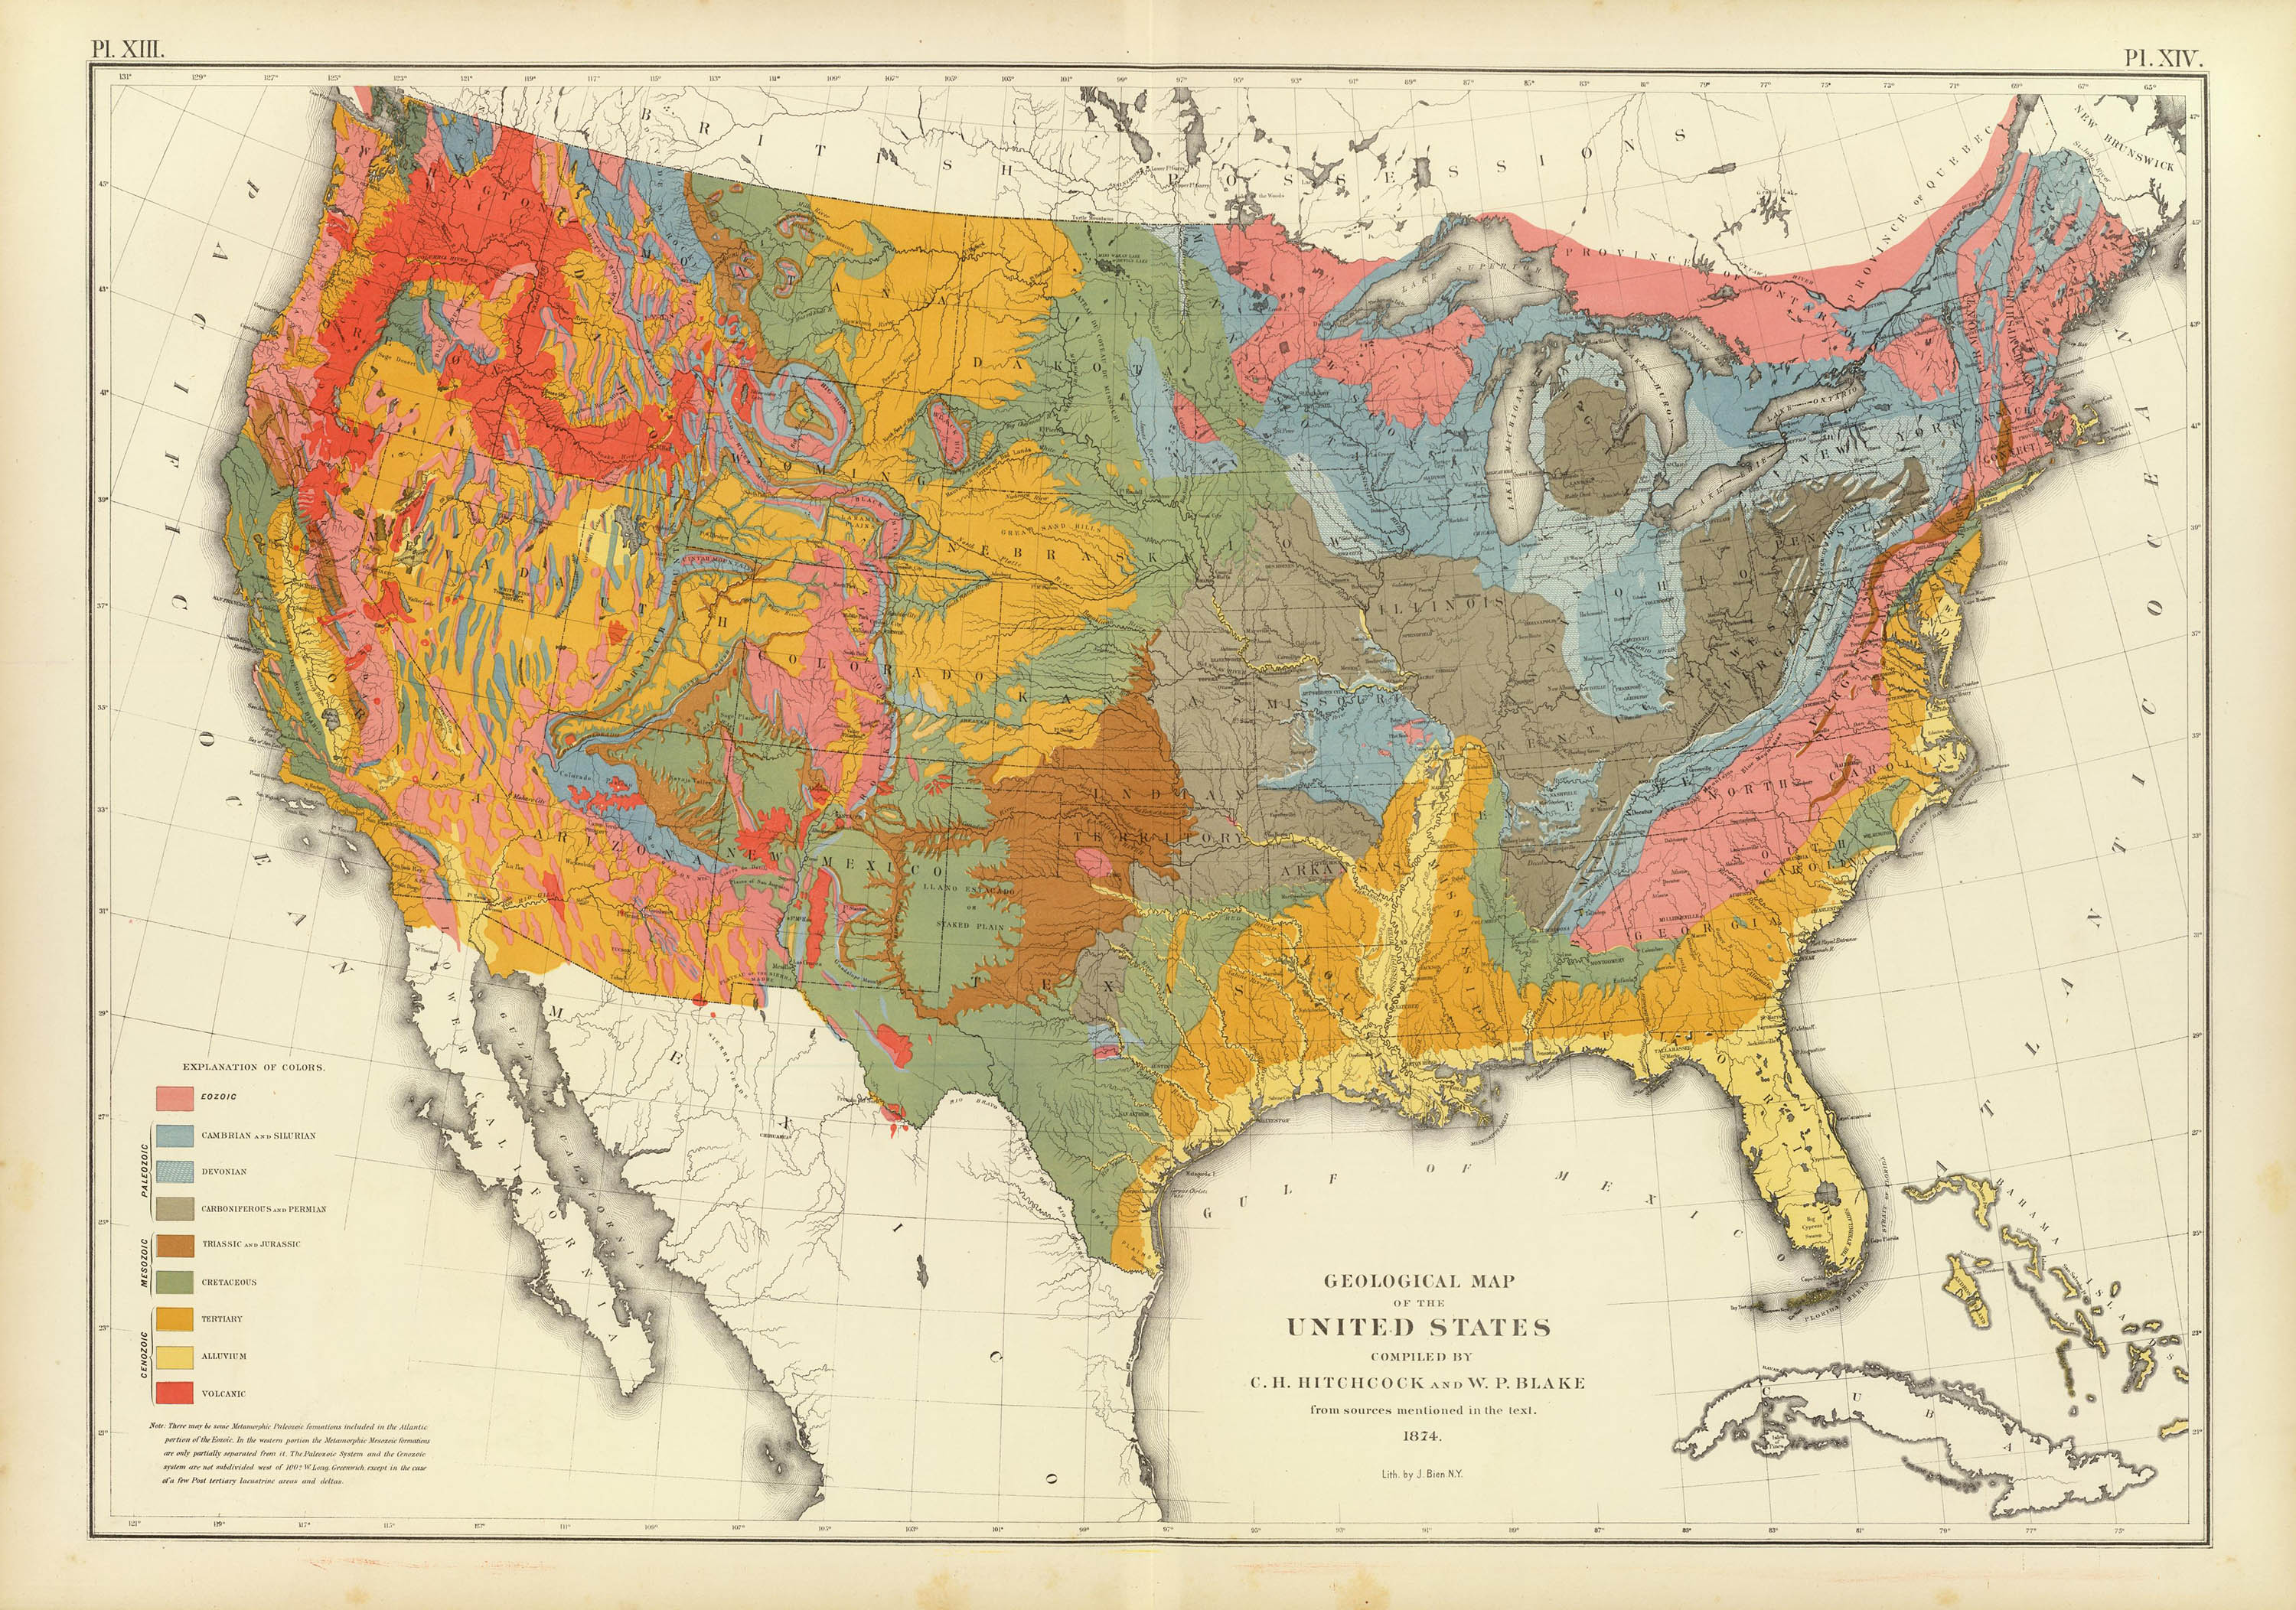
Geological Map. From ref. 3
128
The National Altas
Part I - The Statistical Altas of the United States
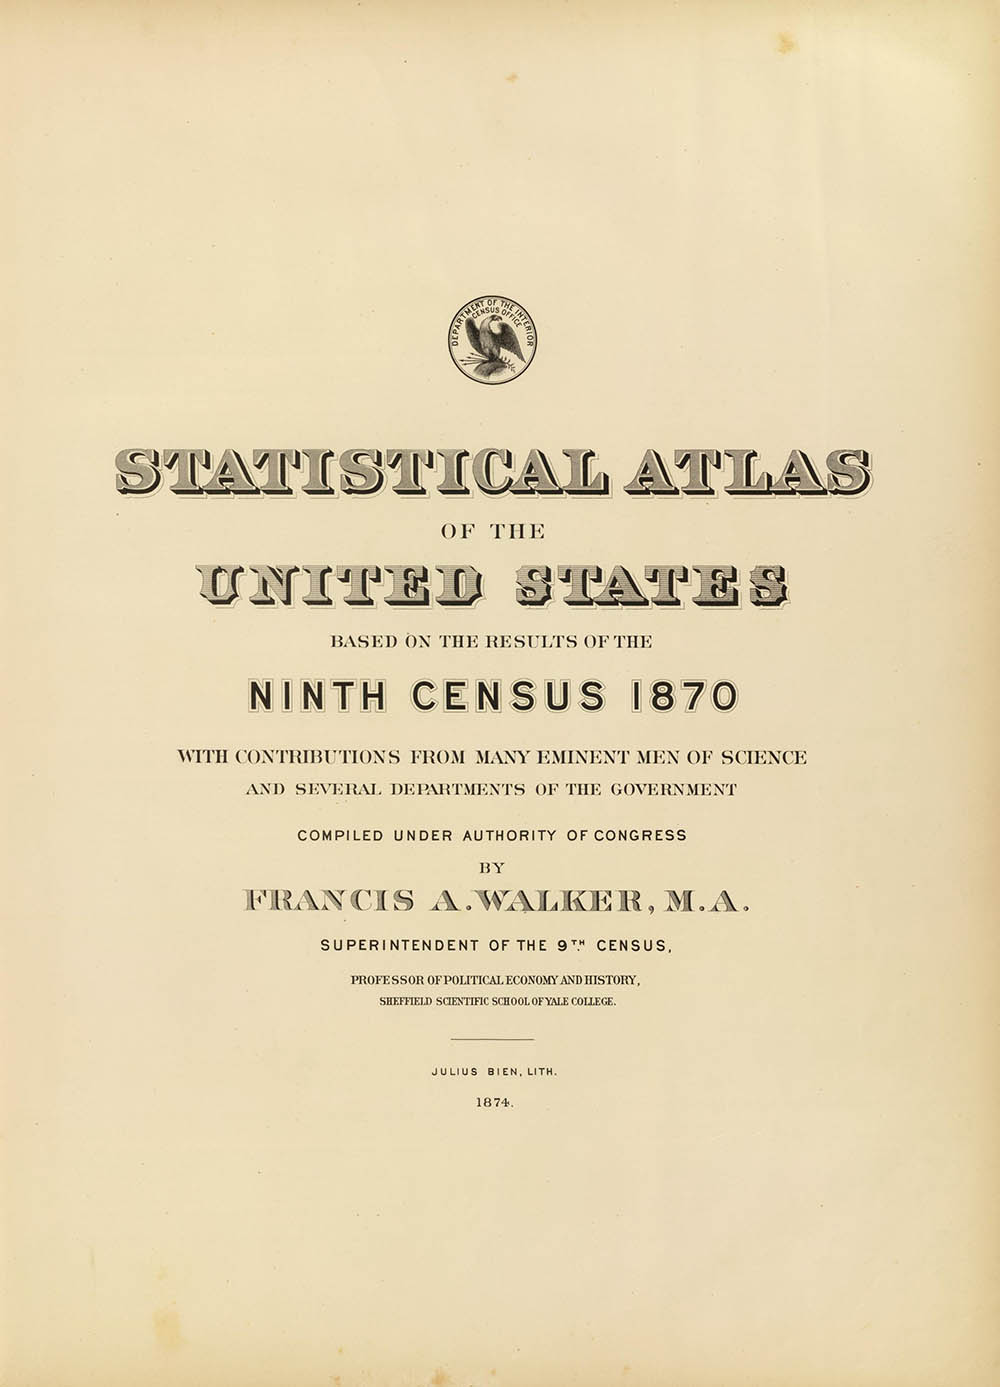
Francis Amasa Walker (2 Jul 1840 – 5 Jan 1897) graduated from Amherst College and practiced law before joining the Union Army where he eventually rose to the rank of Brevet Brigadier General. In 1869 he became the Chief of the Bureau of Statistics and on 7 Feb 1870, at age 29, was appointed the Superintendent of the Ninth Census.1
The census began on 1 Jun 1870 and the first collated results were completed by 23 Aug 1871. Using this advance data Walker “had caused to be laid down in color upon outline-maps of the United States, the proportions disclosed by the enumeration as existing in the several sections of the country, between the aggregate population and its principal constituent elements.” In other words – a statistical population map.
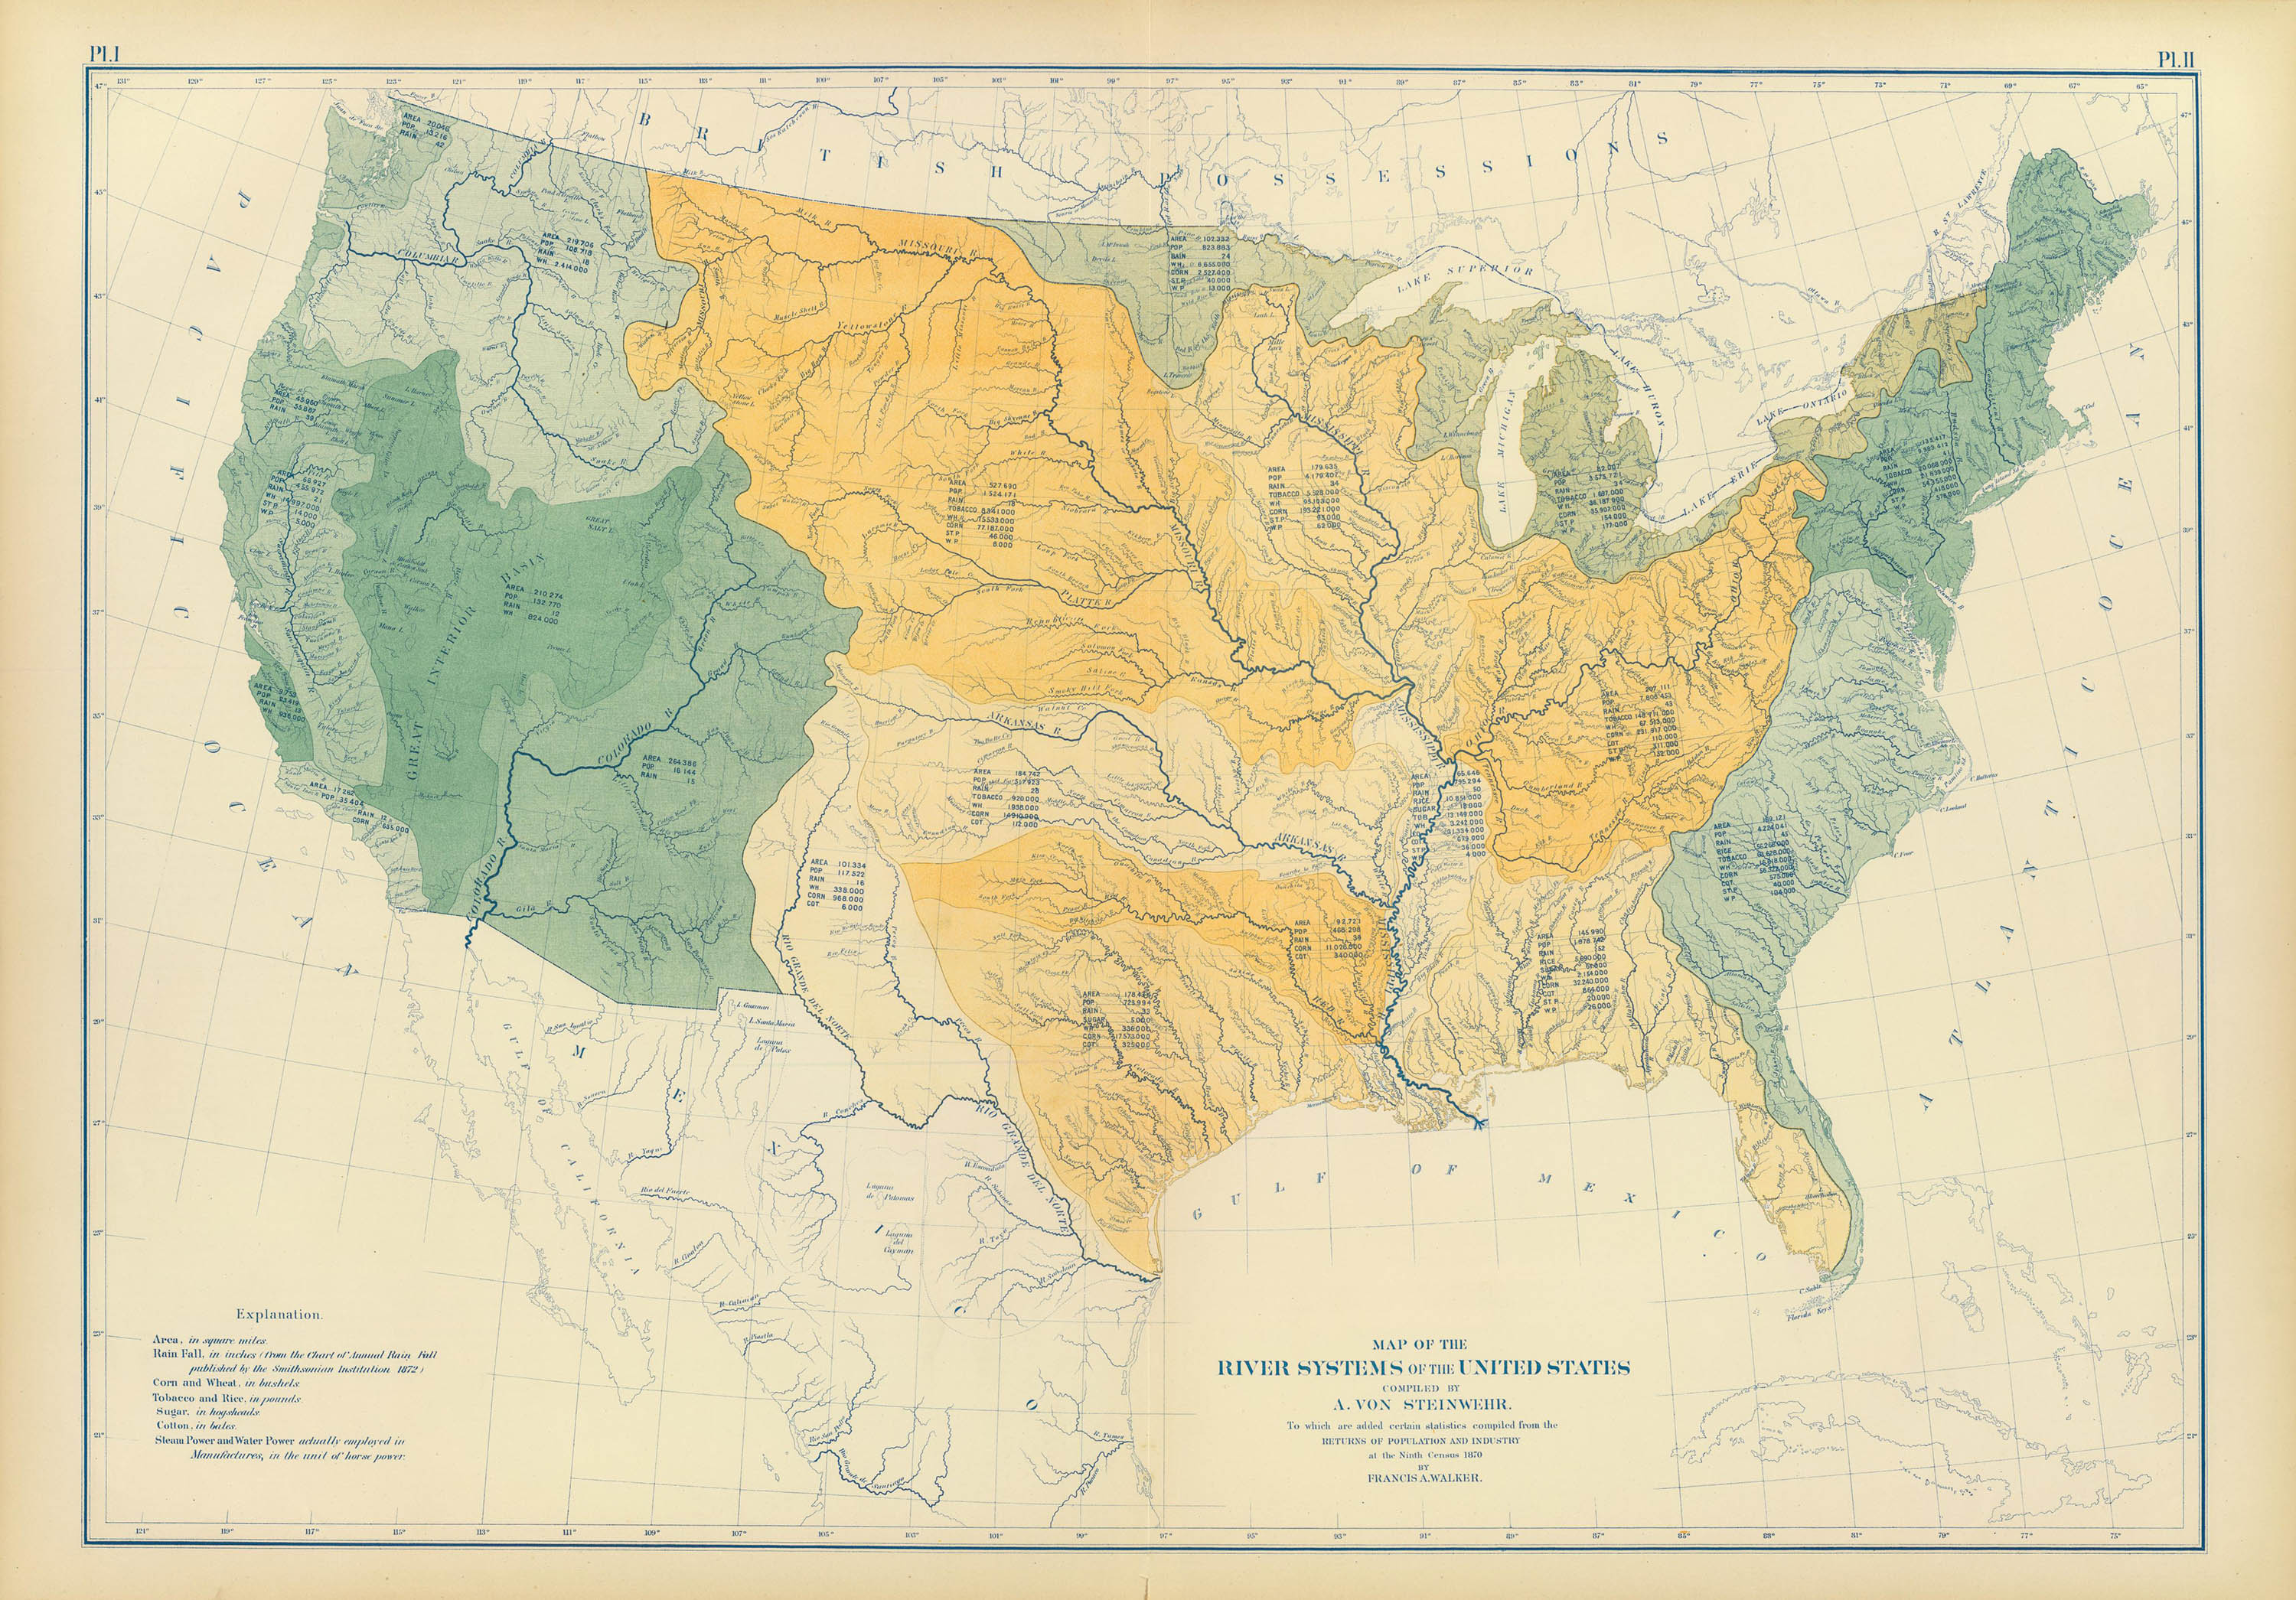
River Systems
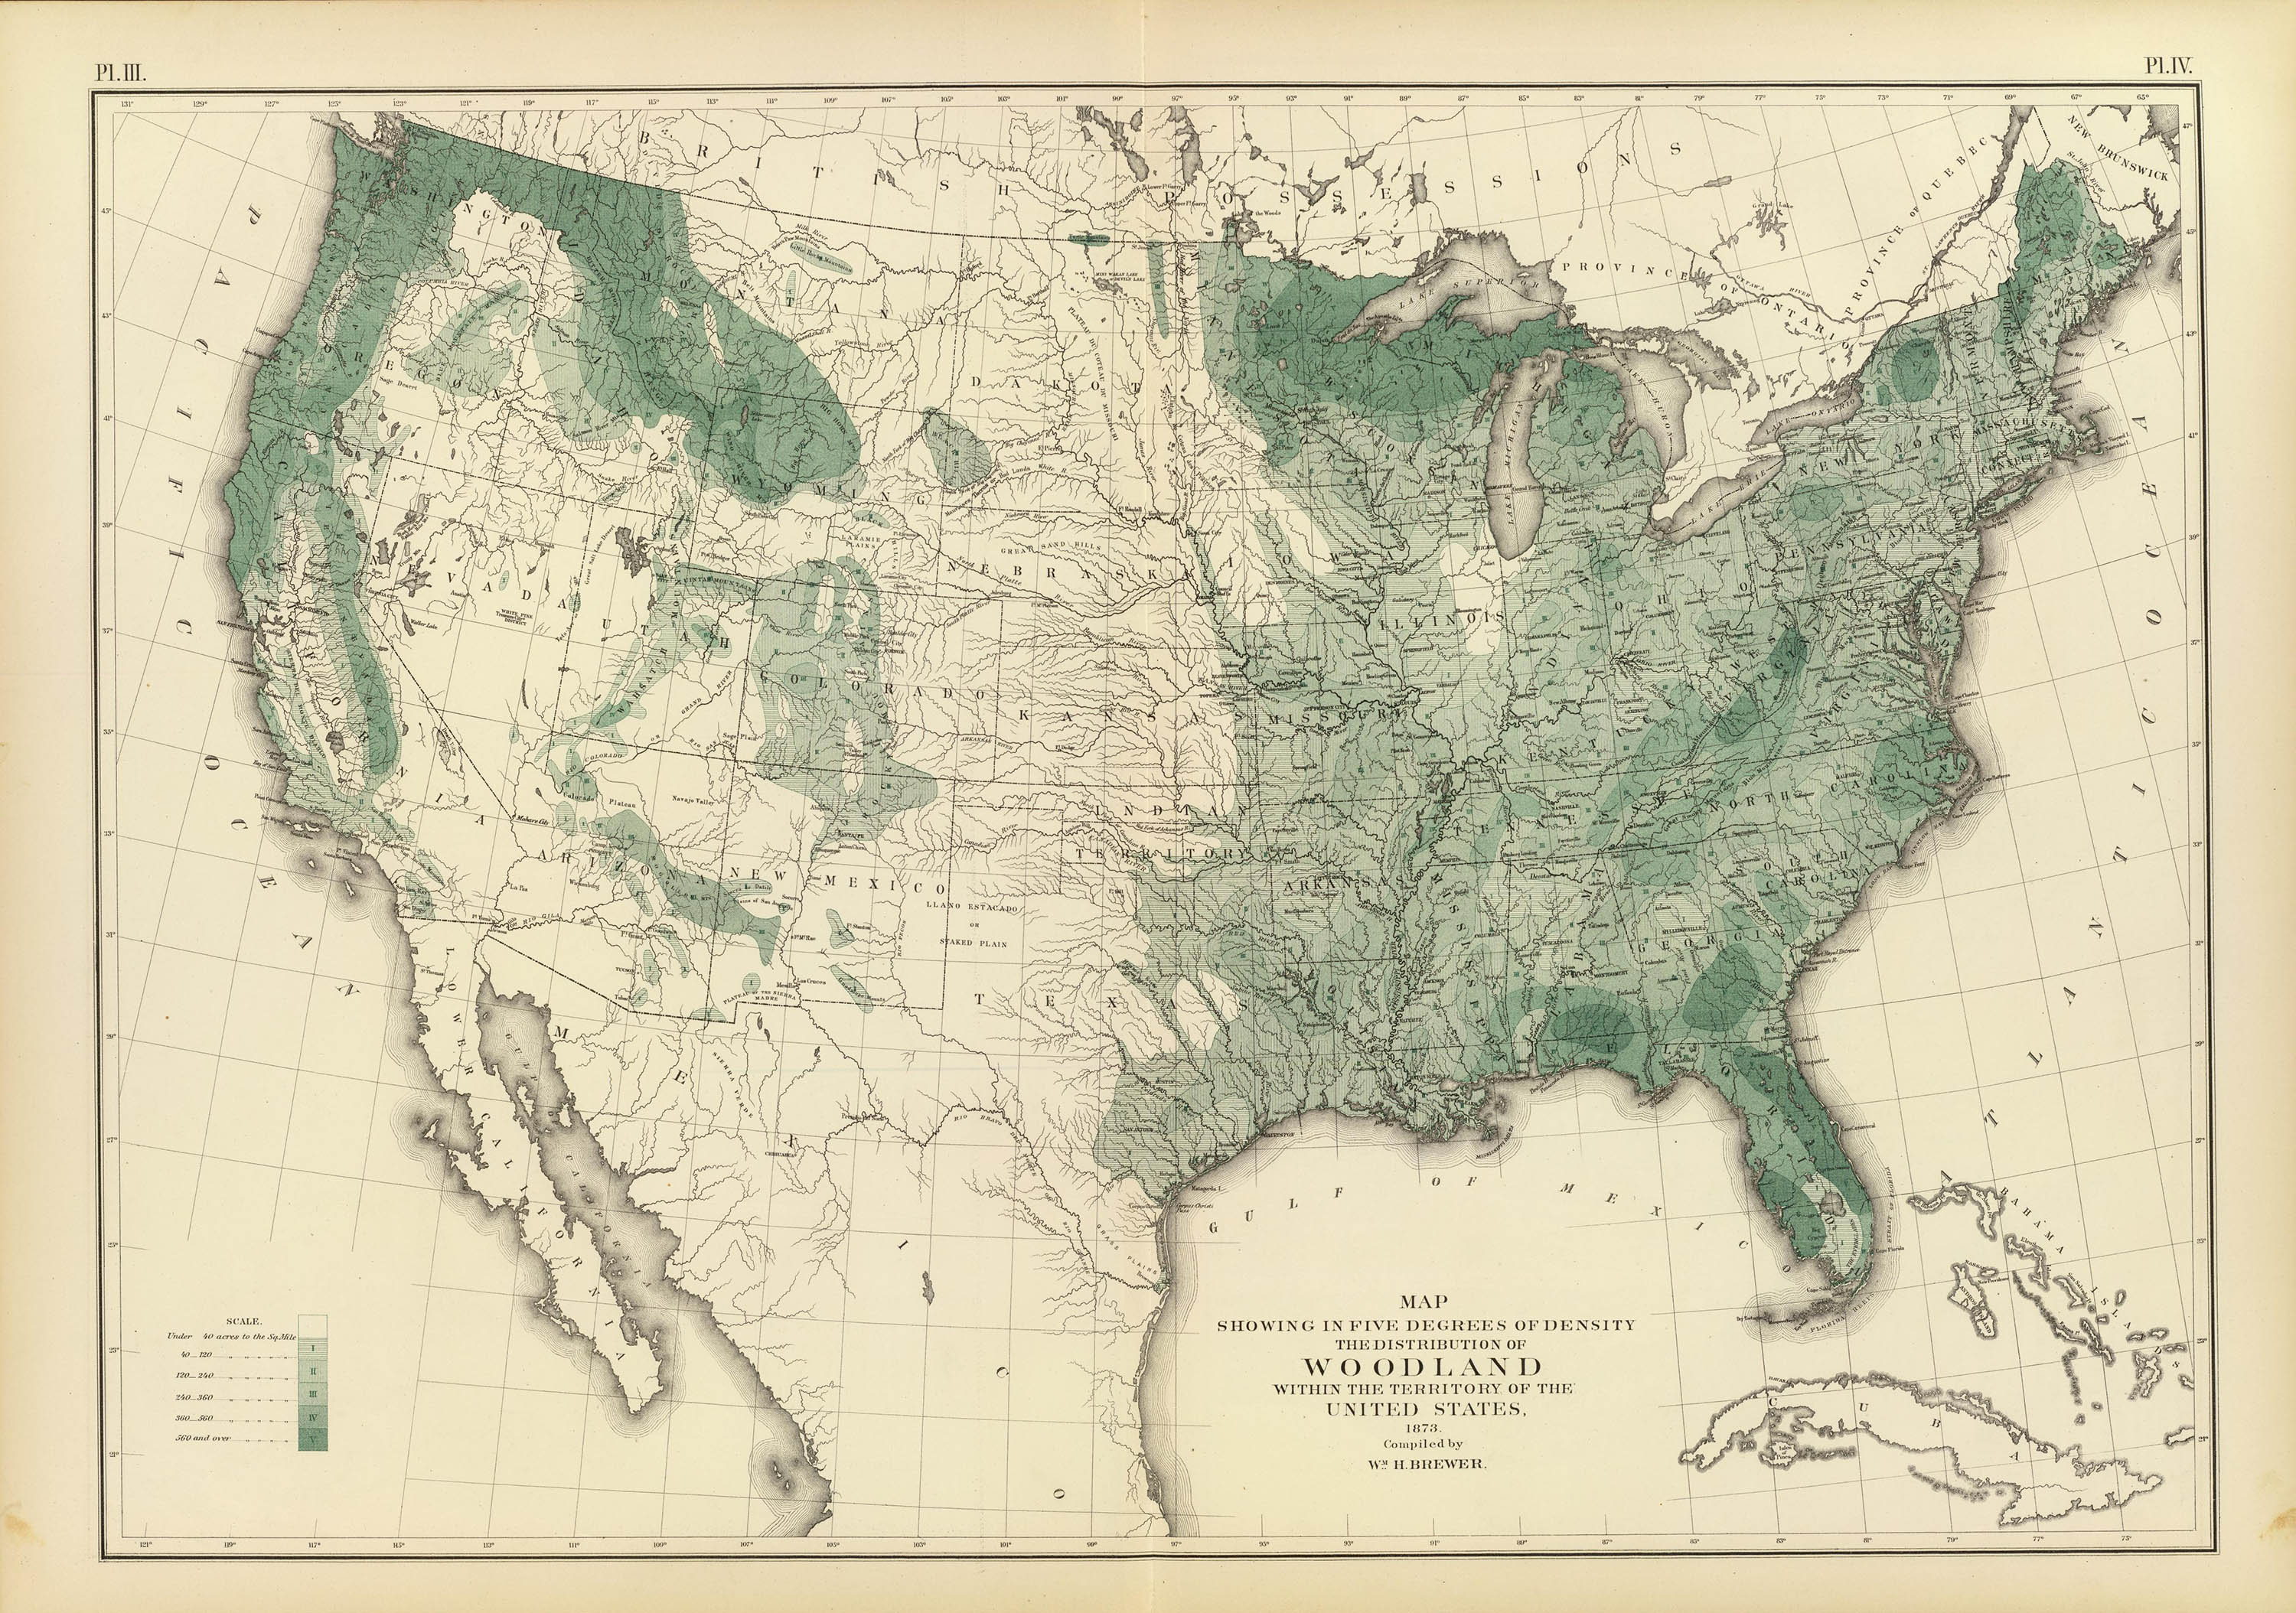
Distribution of Woodland
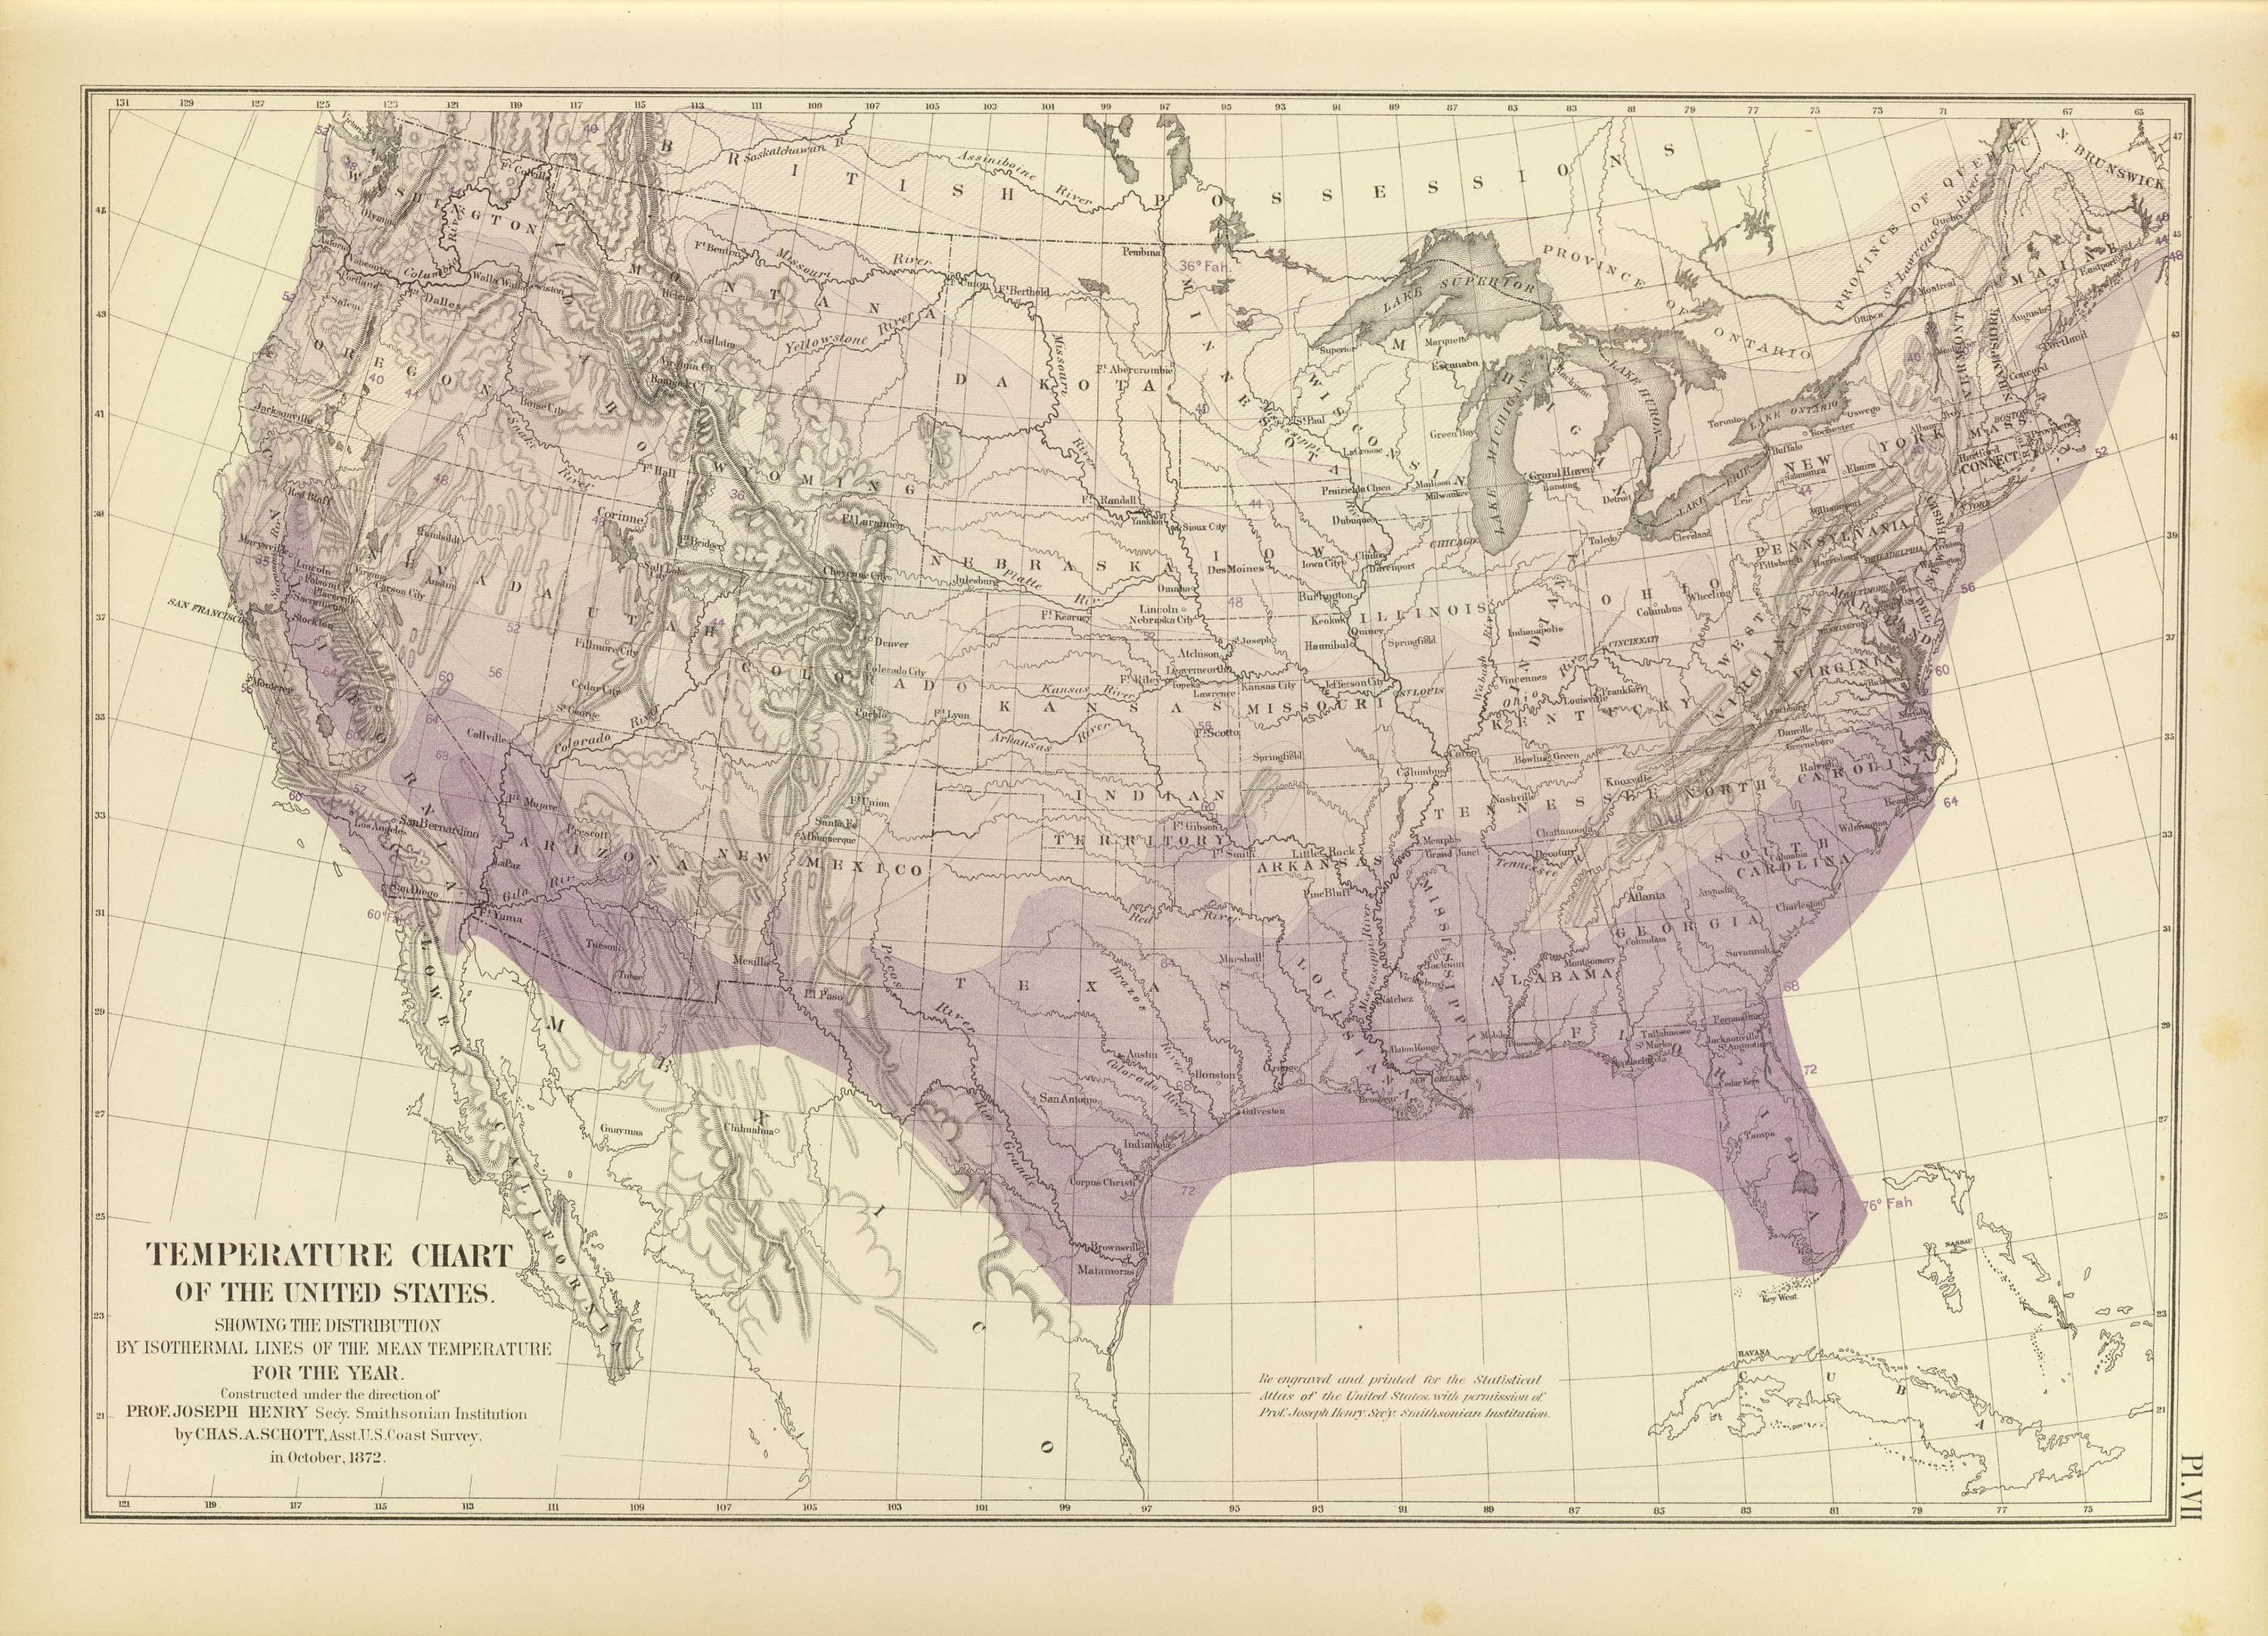
Temperature Chart
A few of Walker’s manuscript maps were presented to the American Geographical Society on 30 Jan 1872 and based on their favorable reaction he lobbied Congress for the funds to prepare a set of 26 maps to be included in the three quarto volumes of the official Census report.2
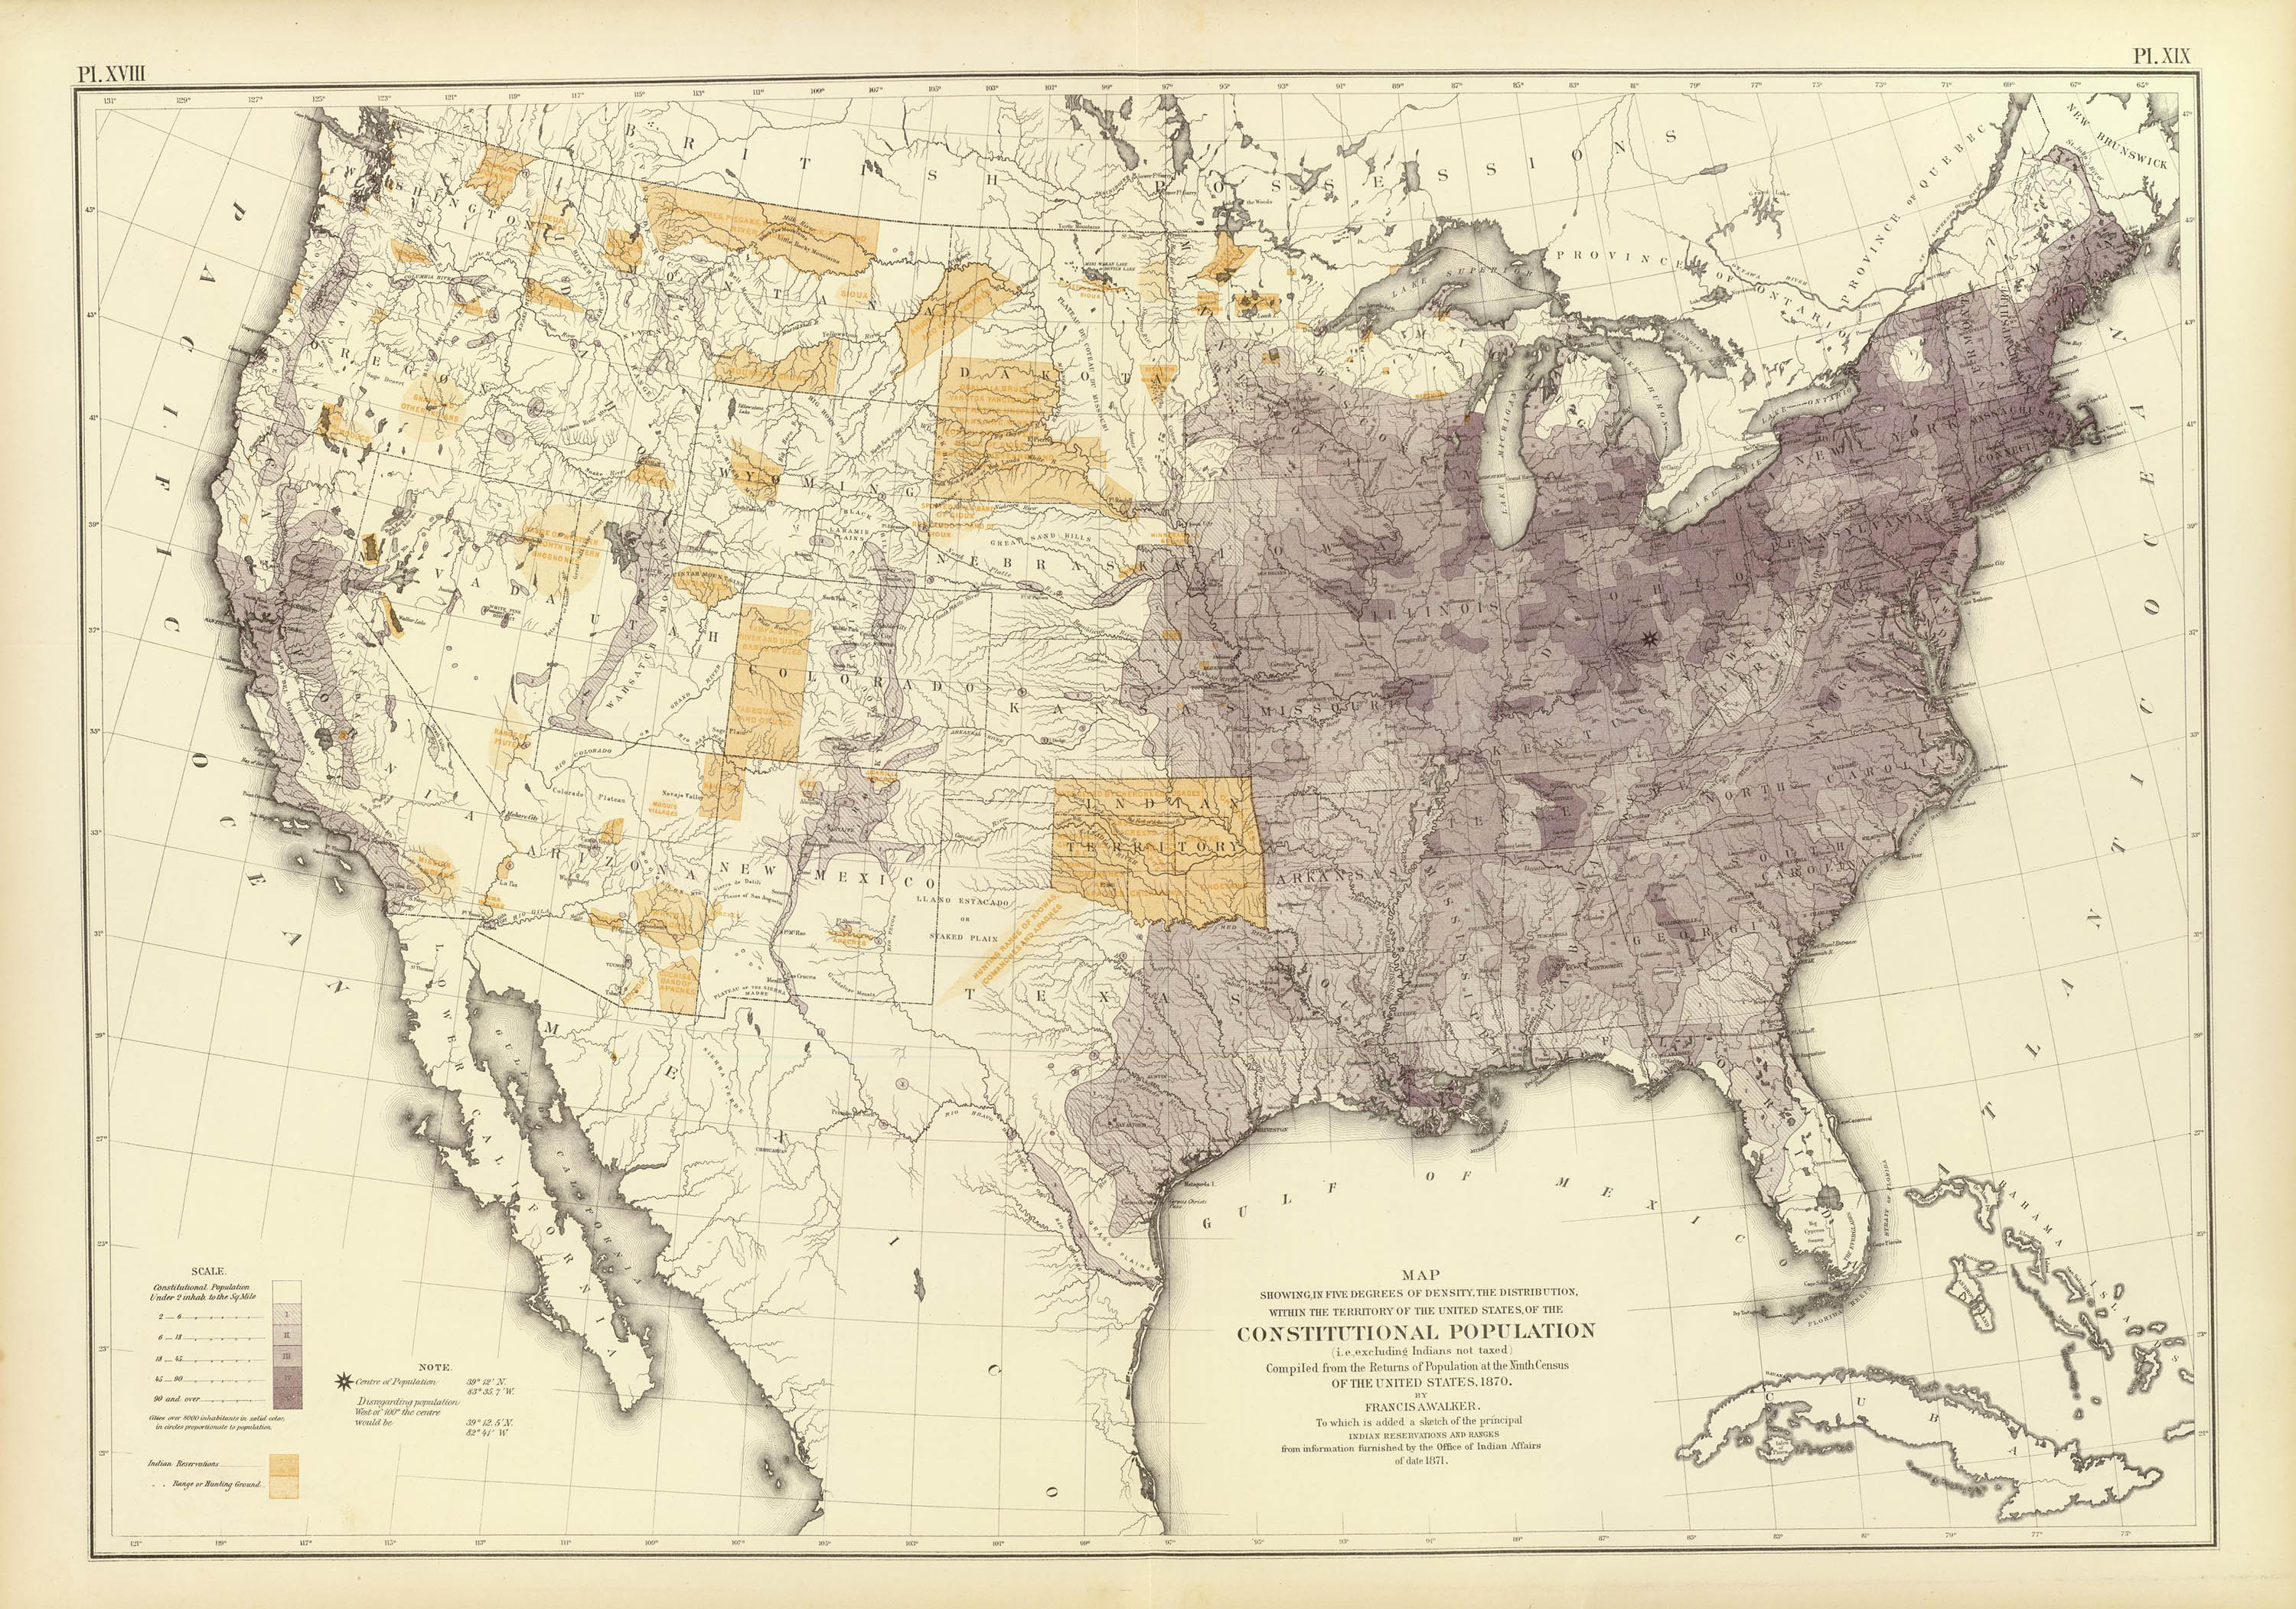
Constitutional Population
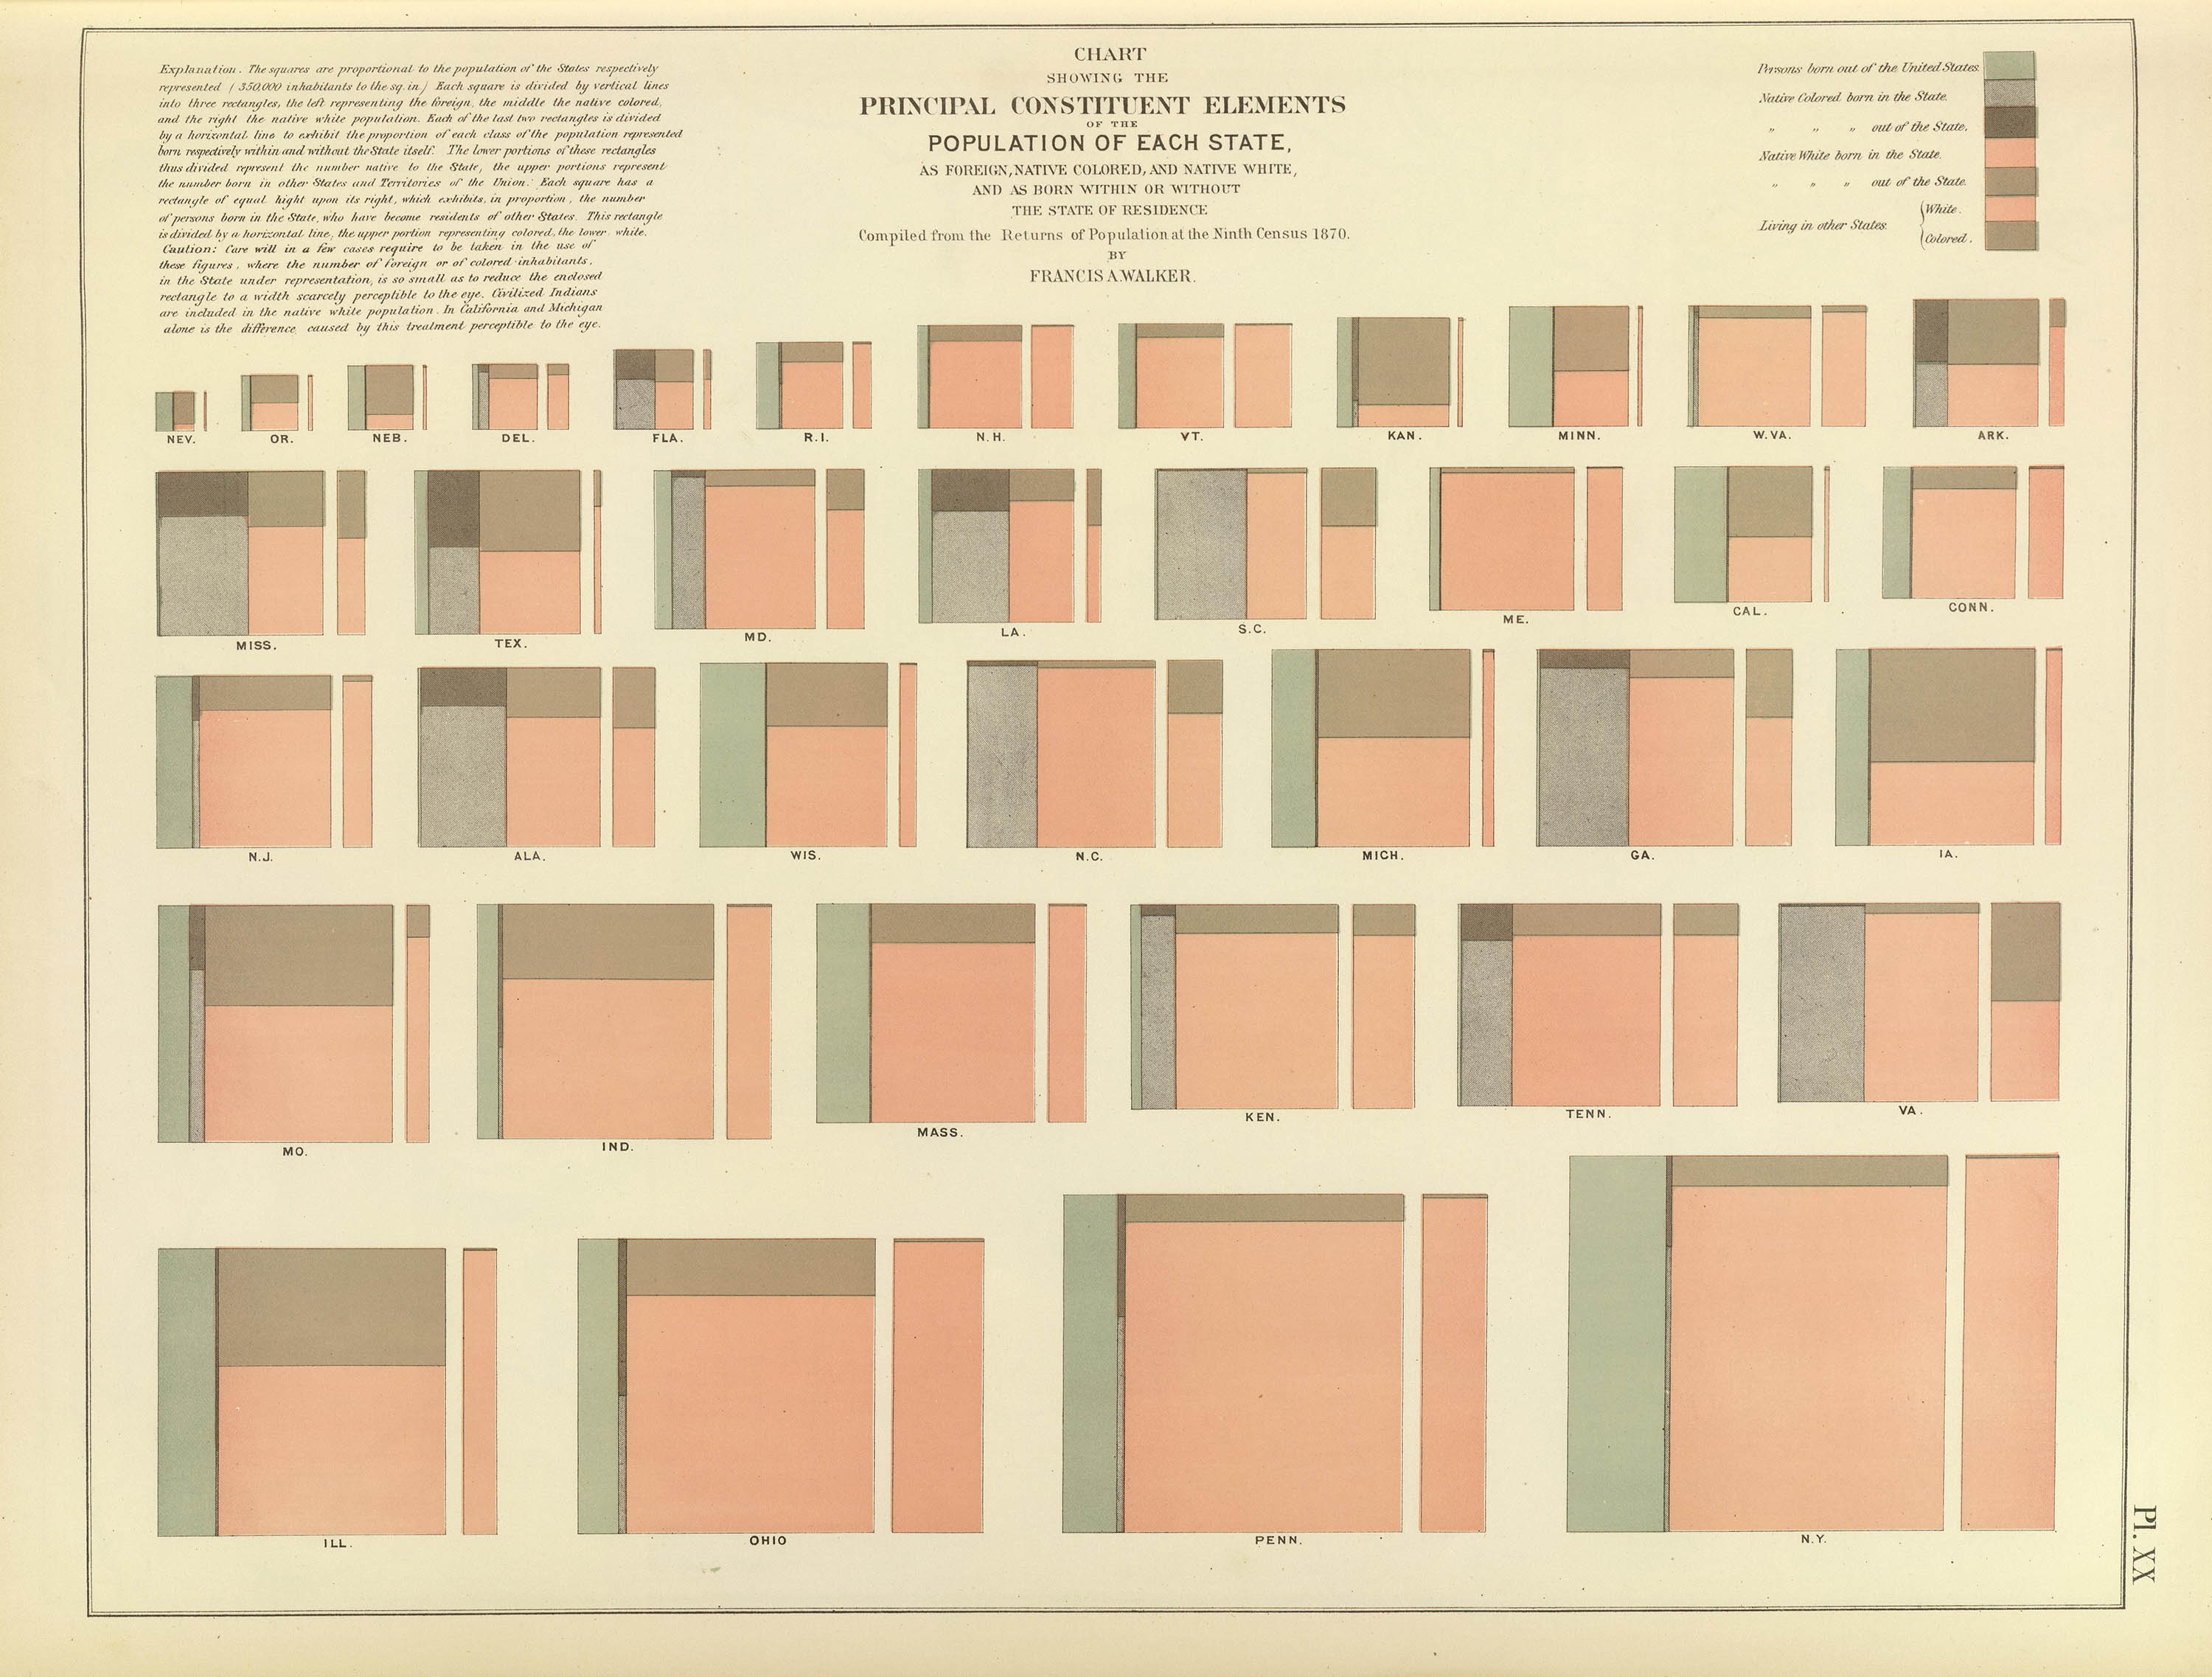
Population of Each State
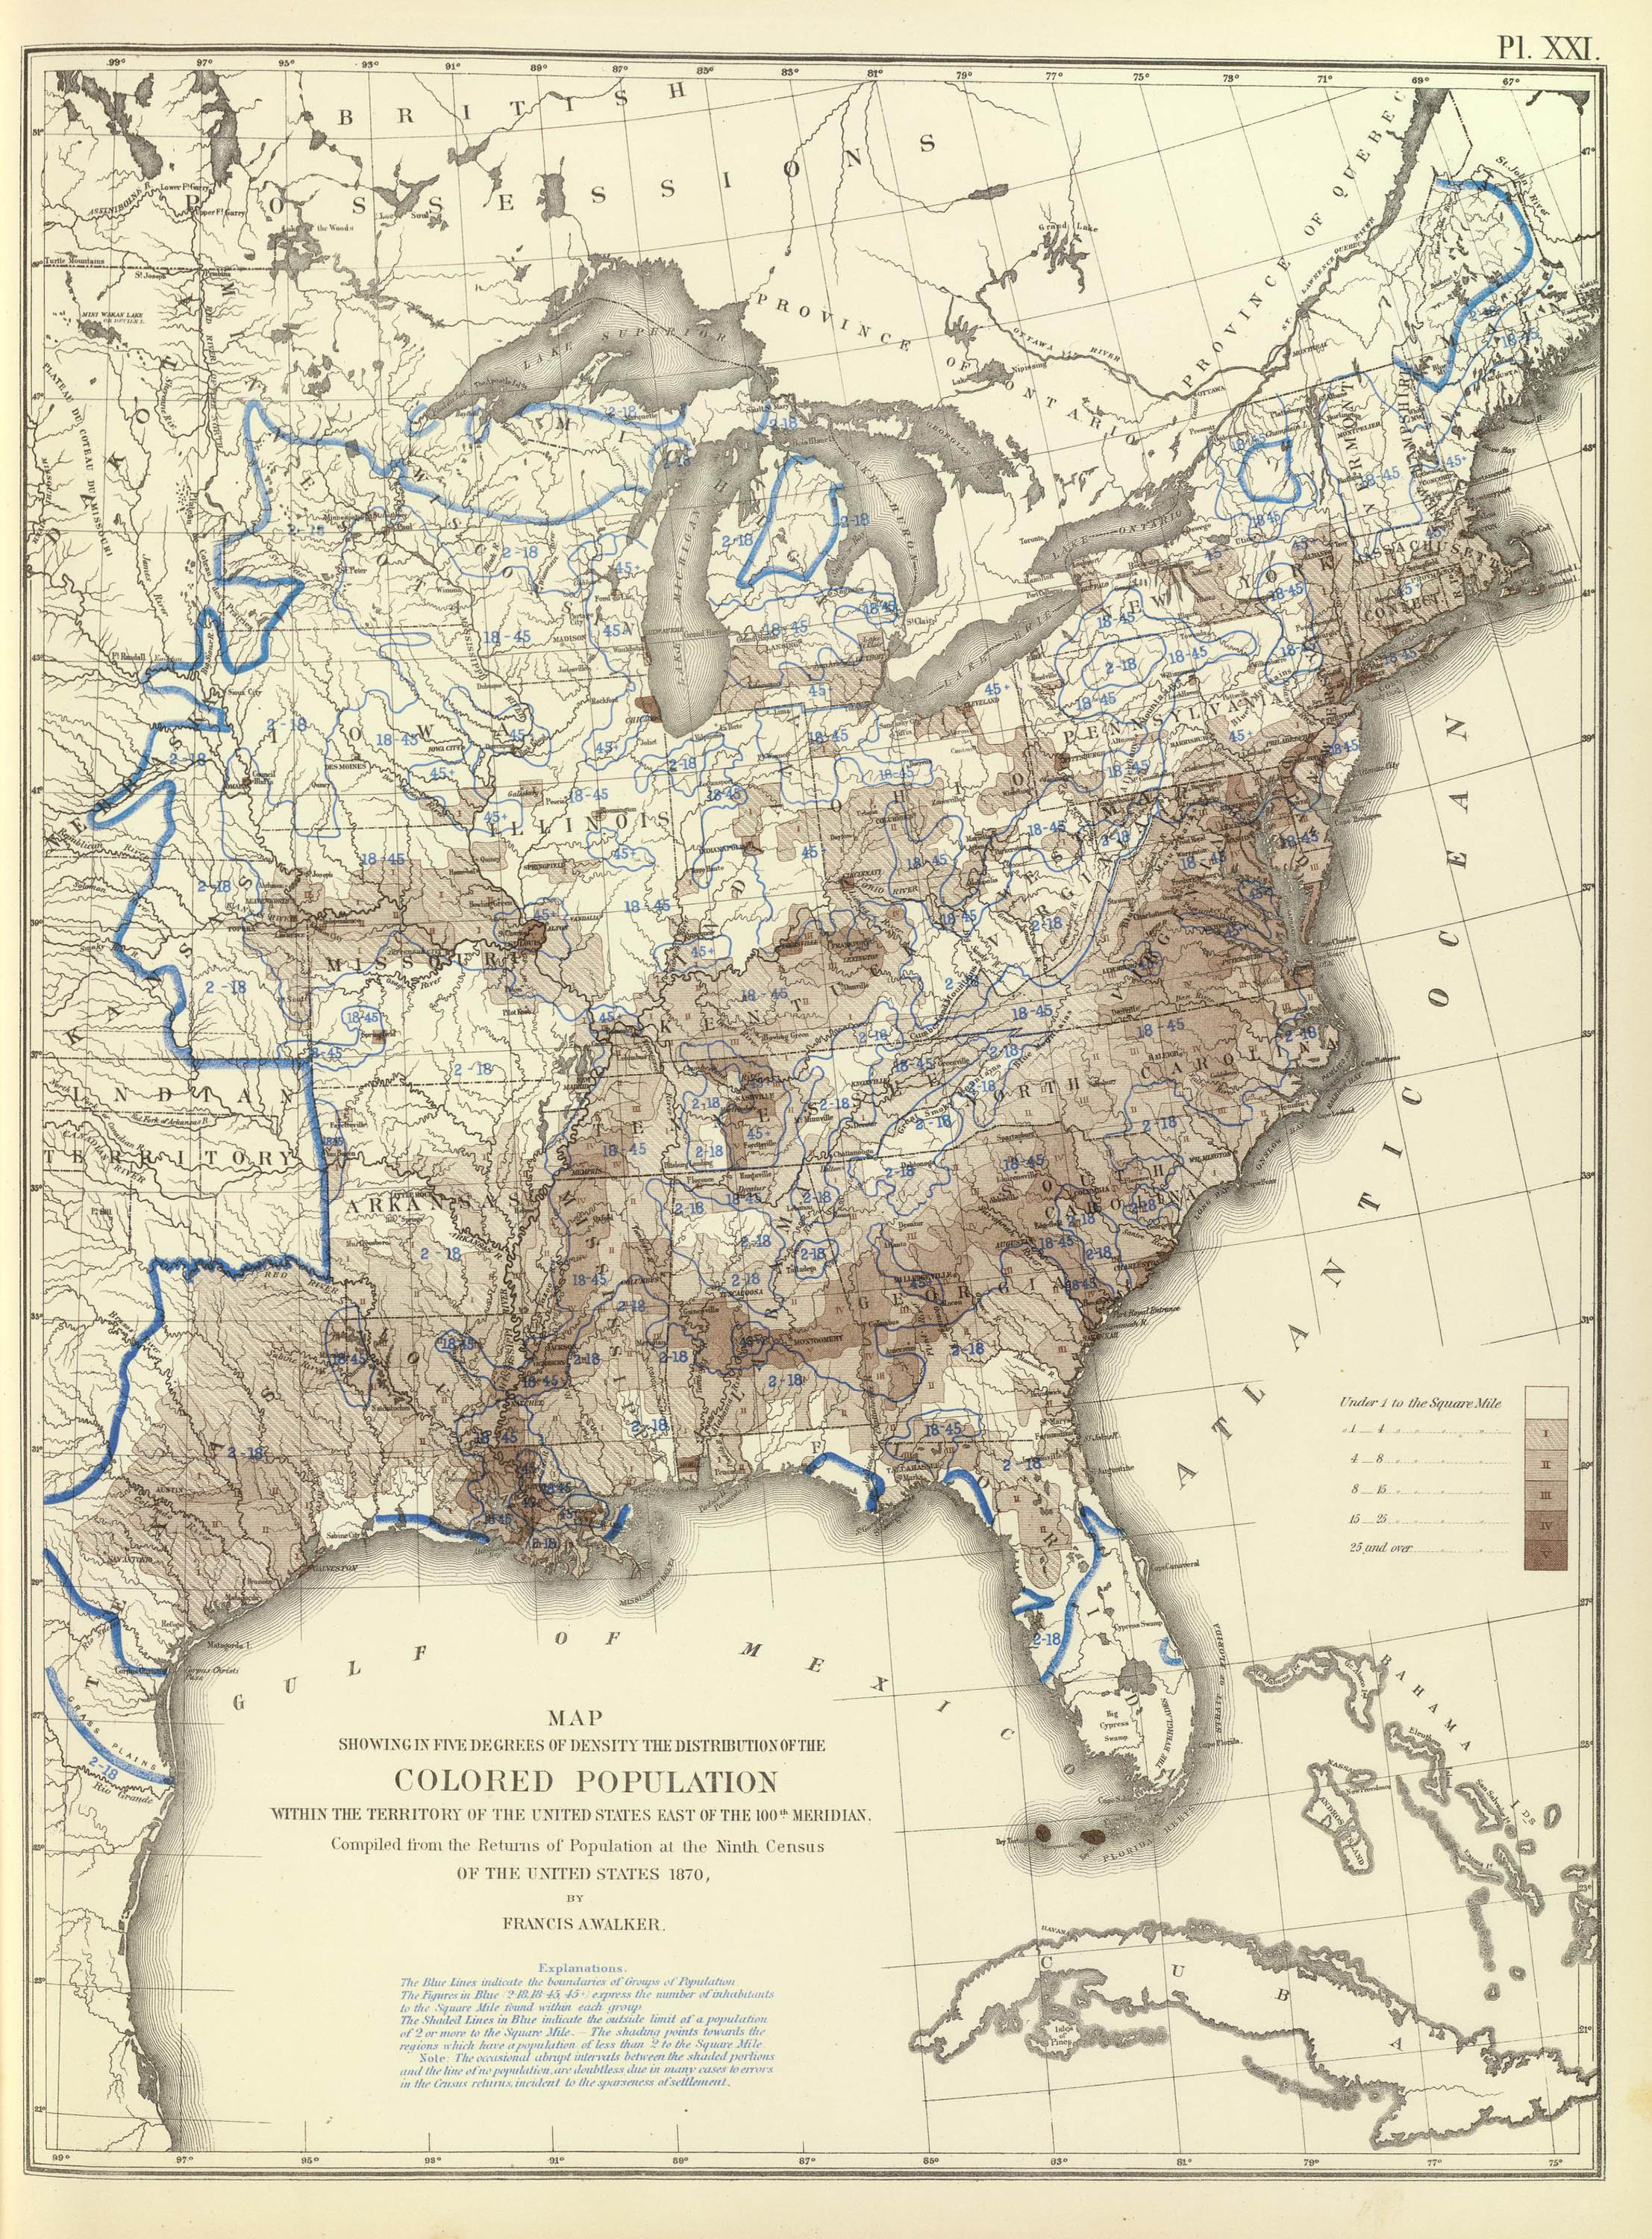
Distribution of the Colored Population 5
As these maps were being published Walker pressed Congress to fund a much more ambitious project – a folio volume of maps covering not only population, social and vital statistics from the Census, but maps of physical features as well.
Walker, along with “the contributions of many eminent men of science,” including the geographer Arnold Guyot of Princeton, geologist Josiah D. Whitney of Harvard, and botanist William H. Brewer of Yale, spent 18 months compiling 60 maps and charts into the Statistical Altas of the United States.3
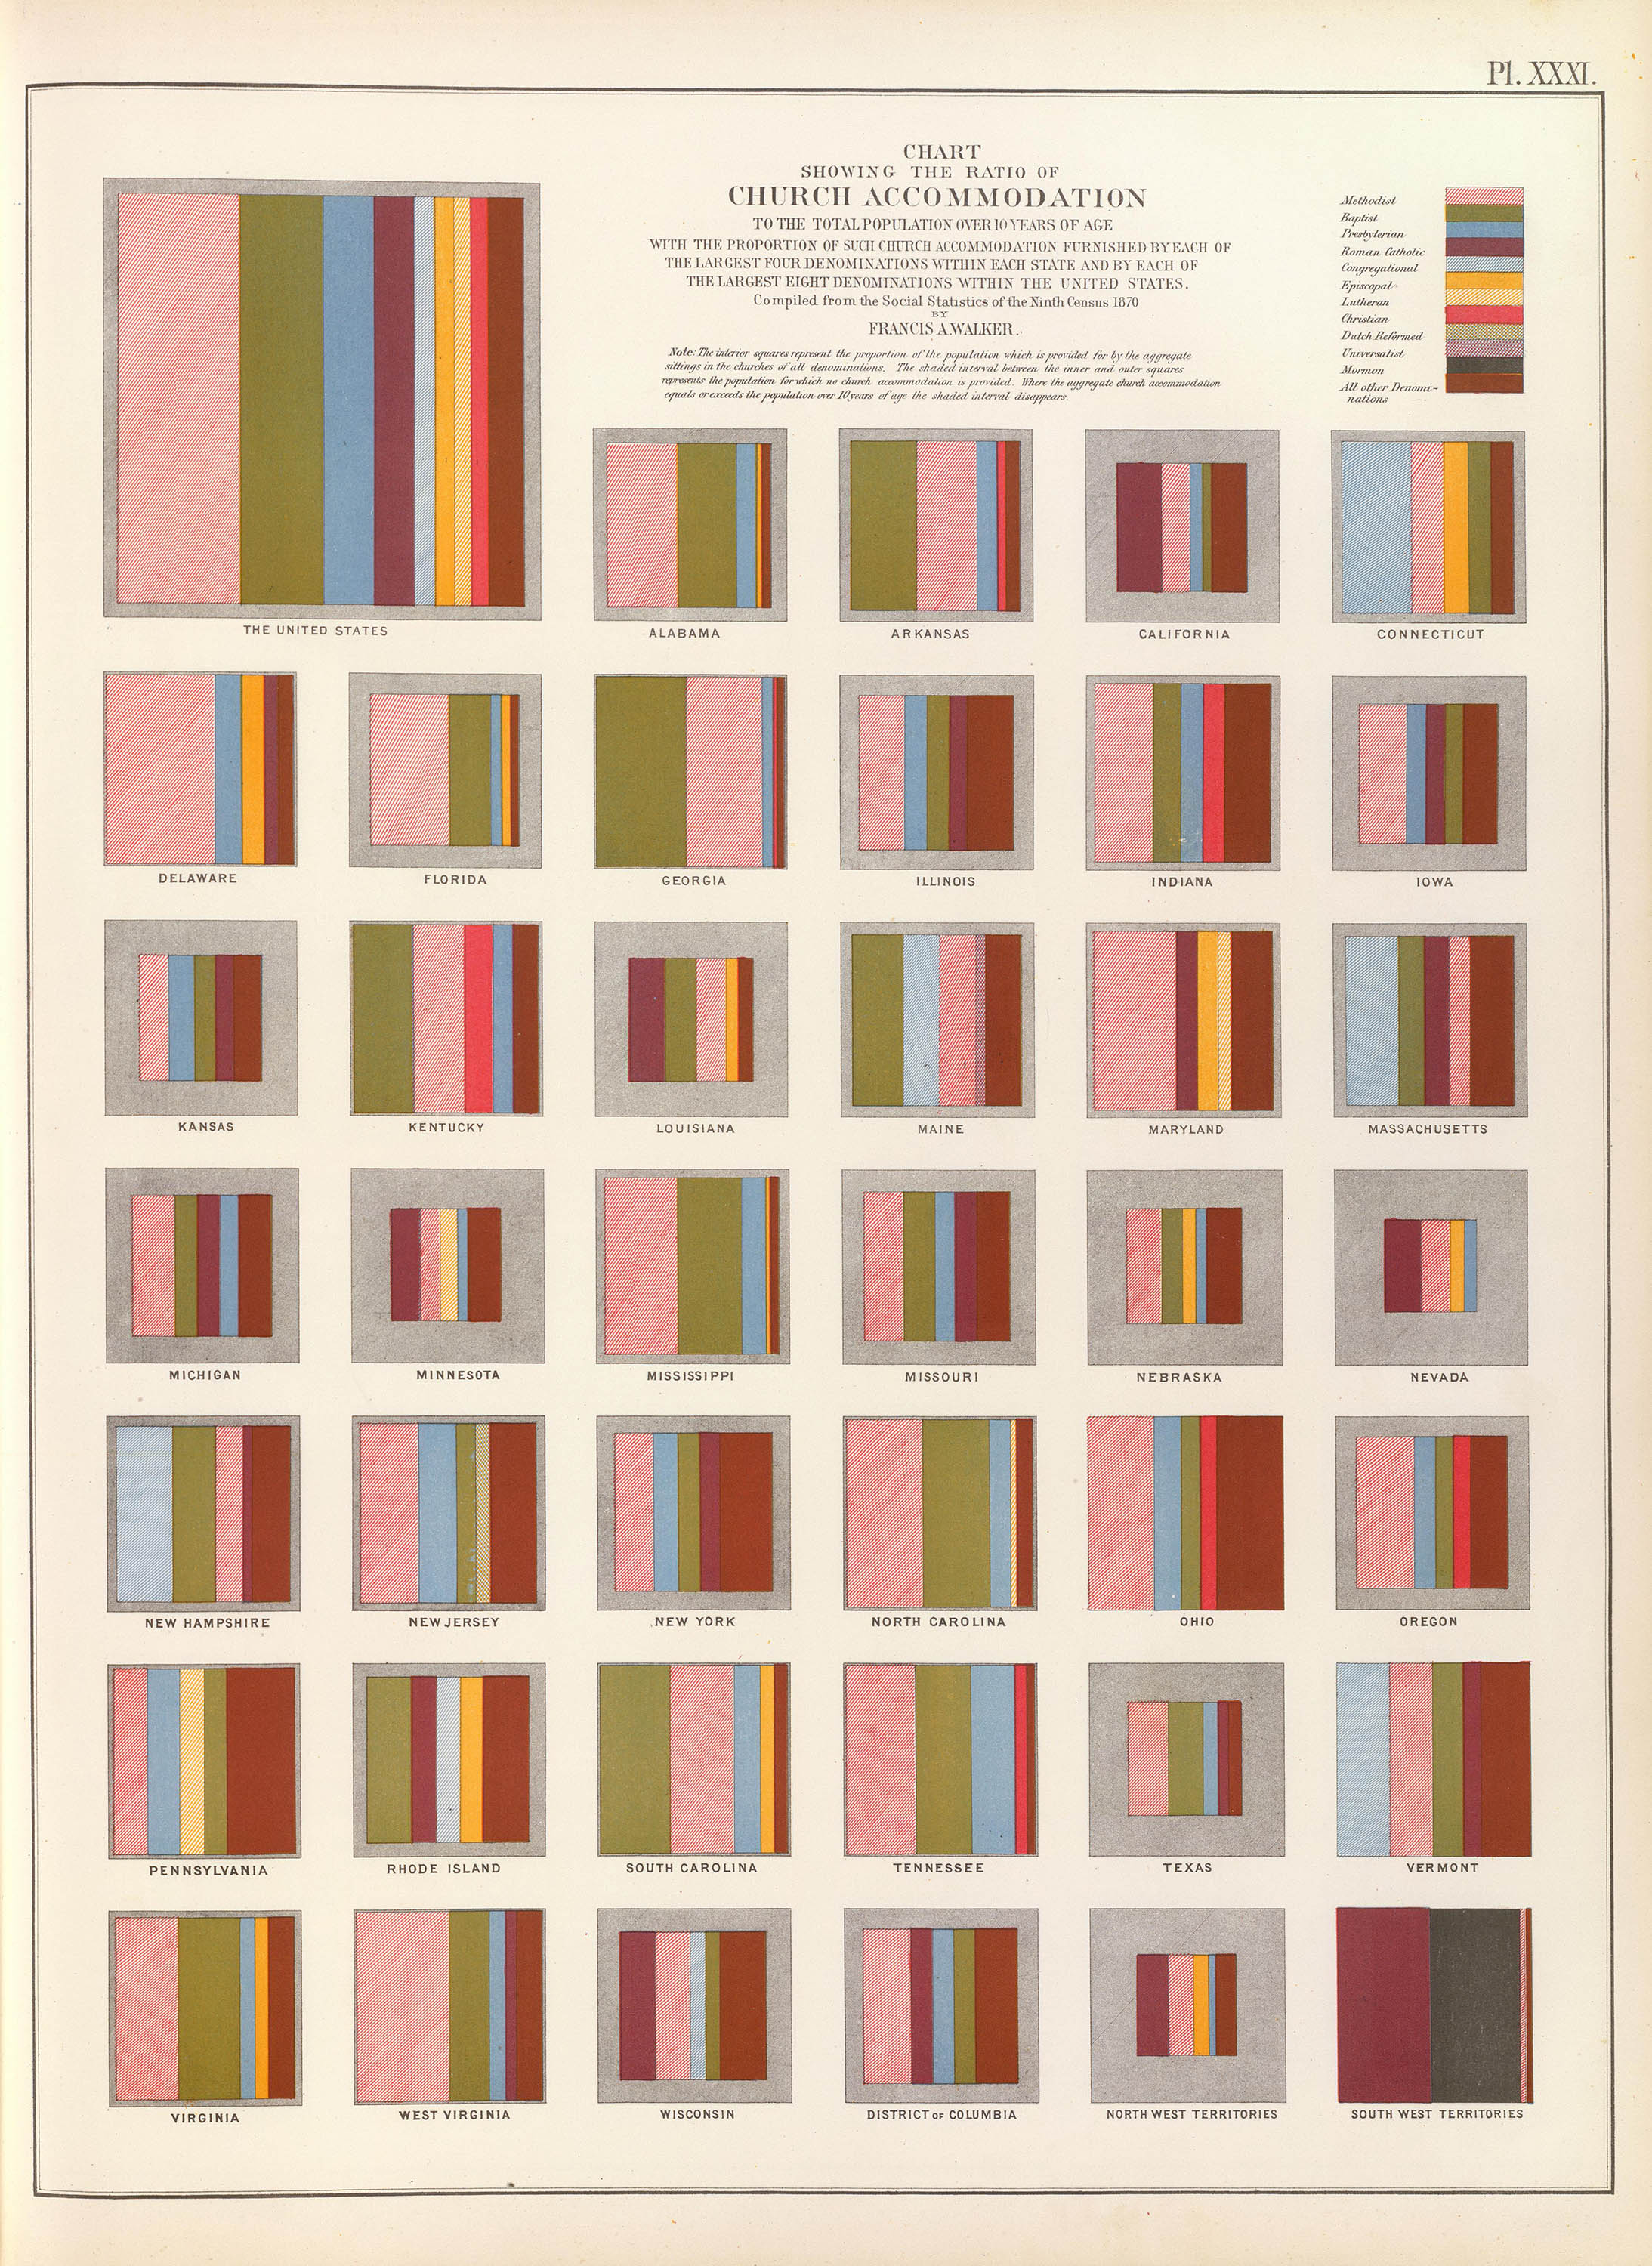
Ratio of Church Accommodation
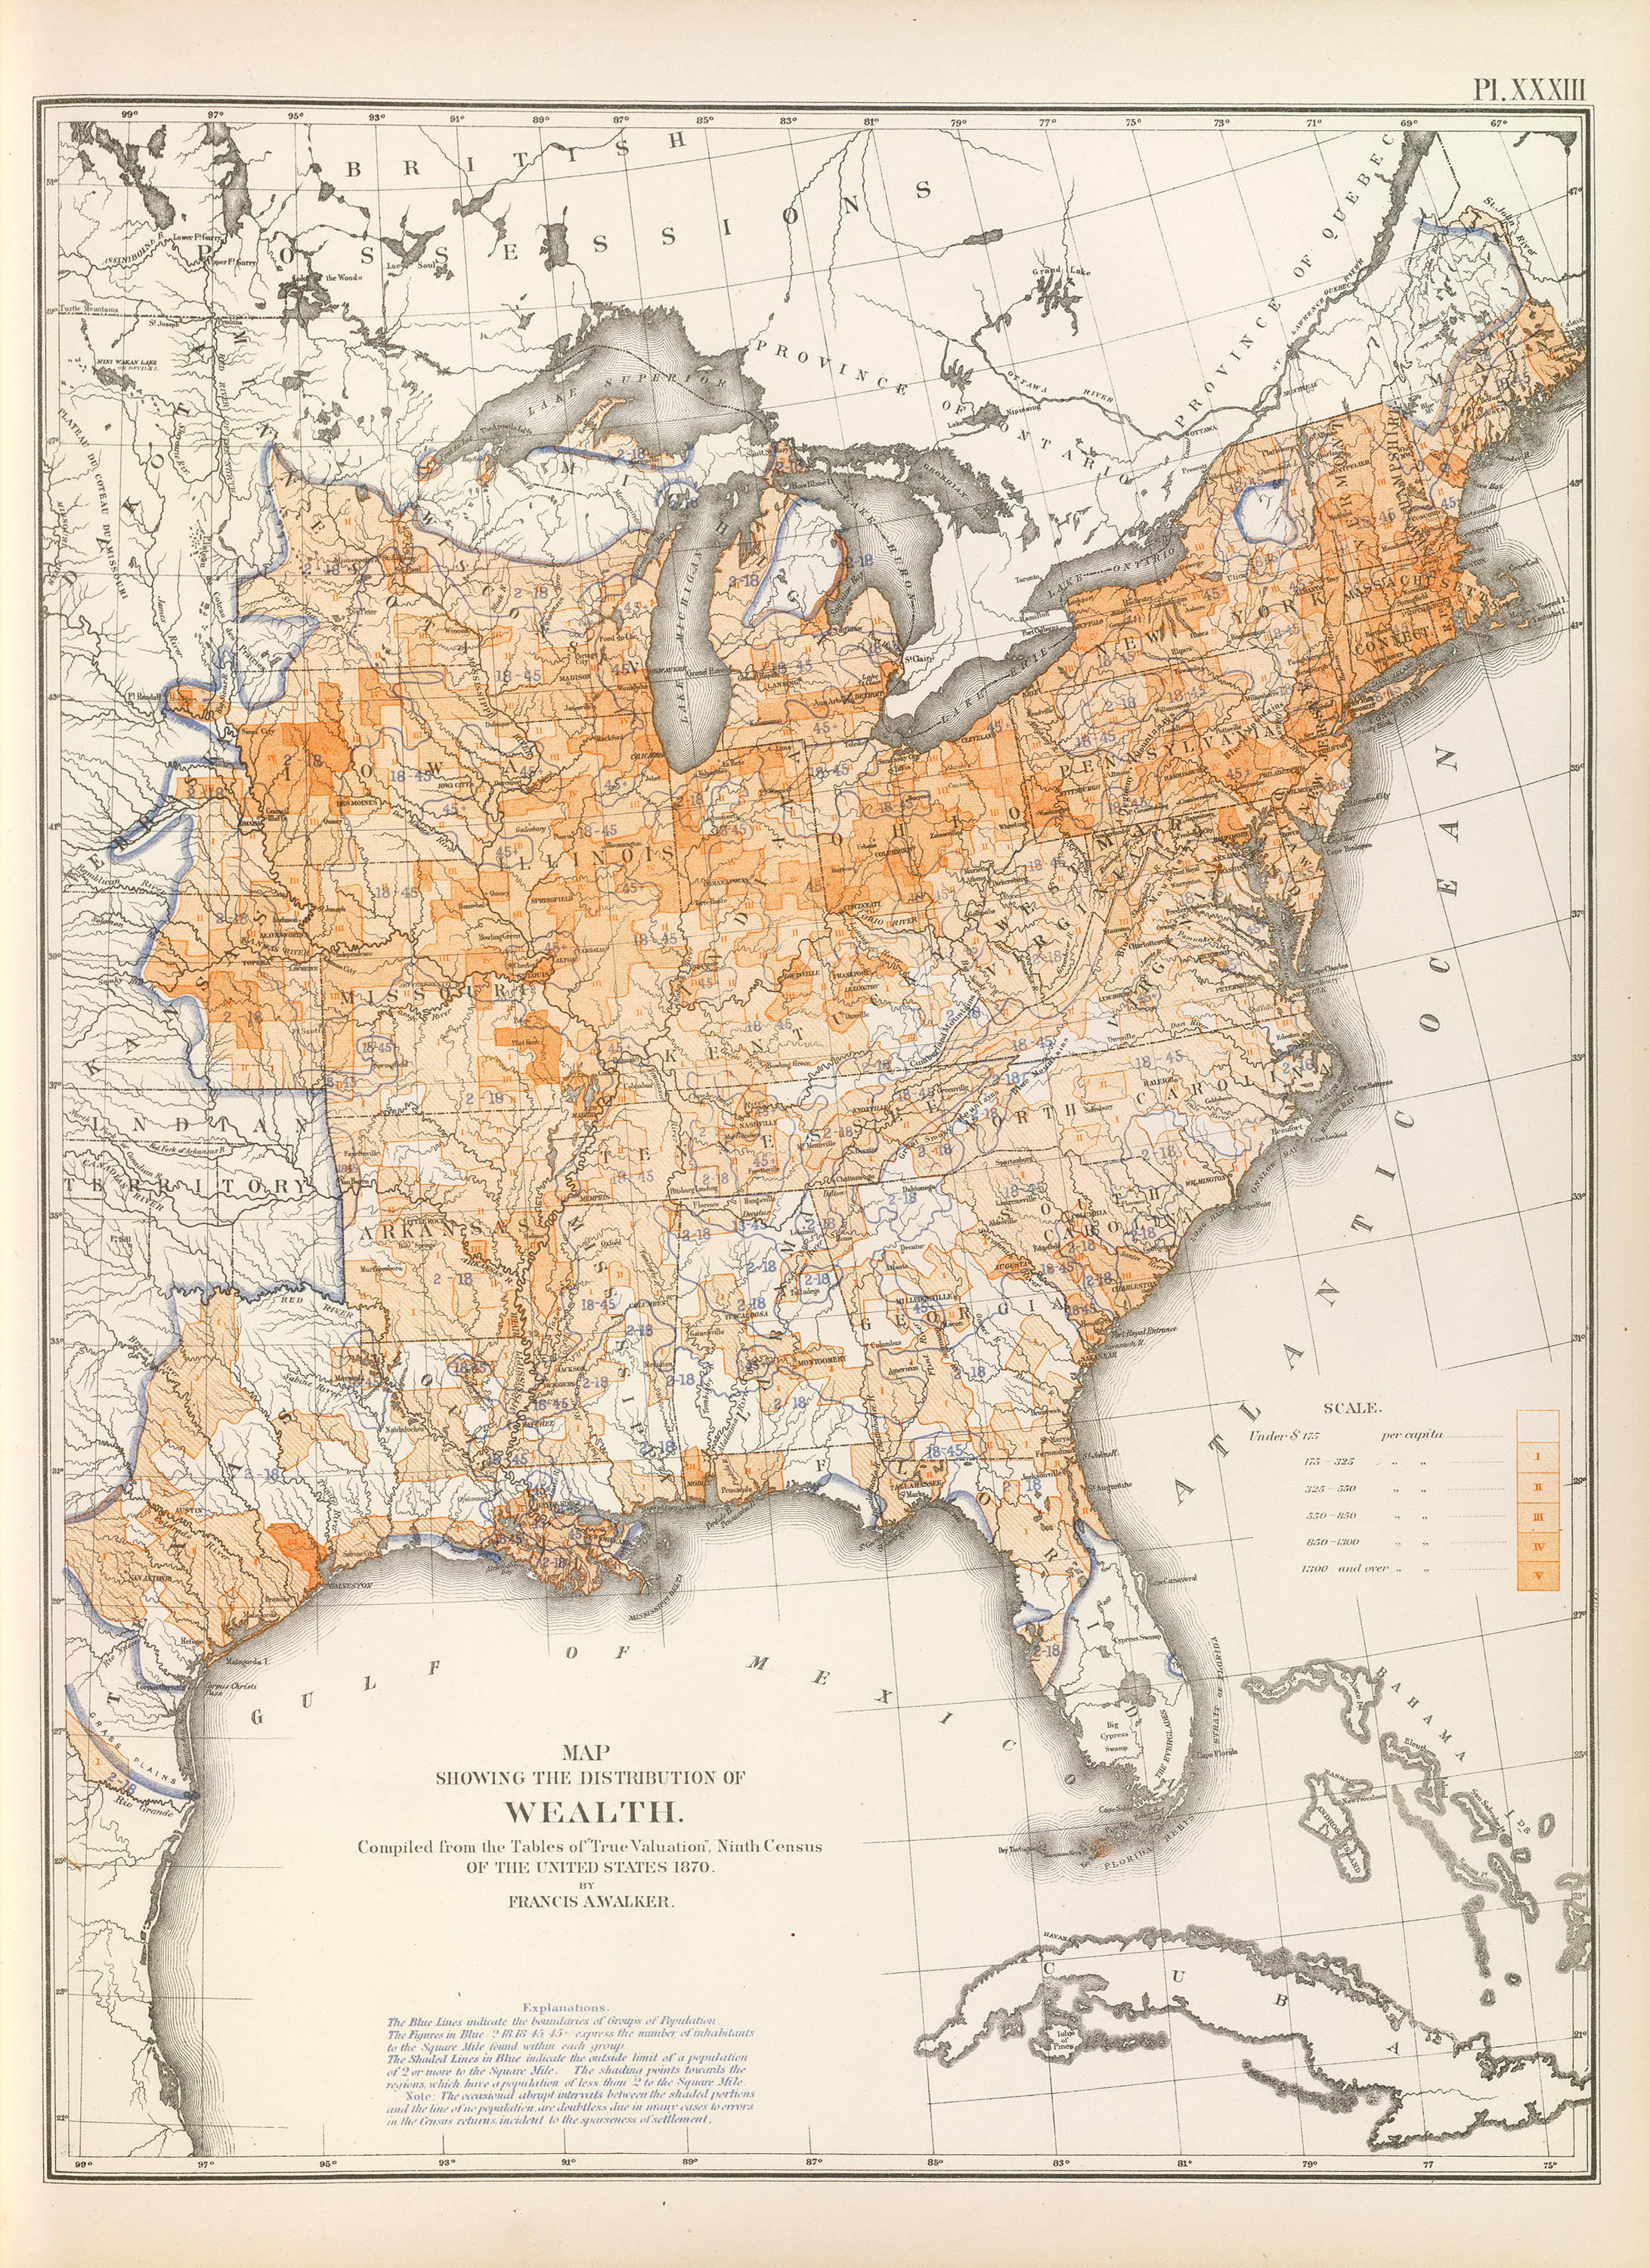
Distribution of Wealth
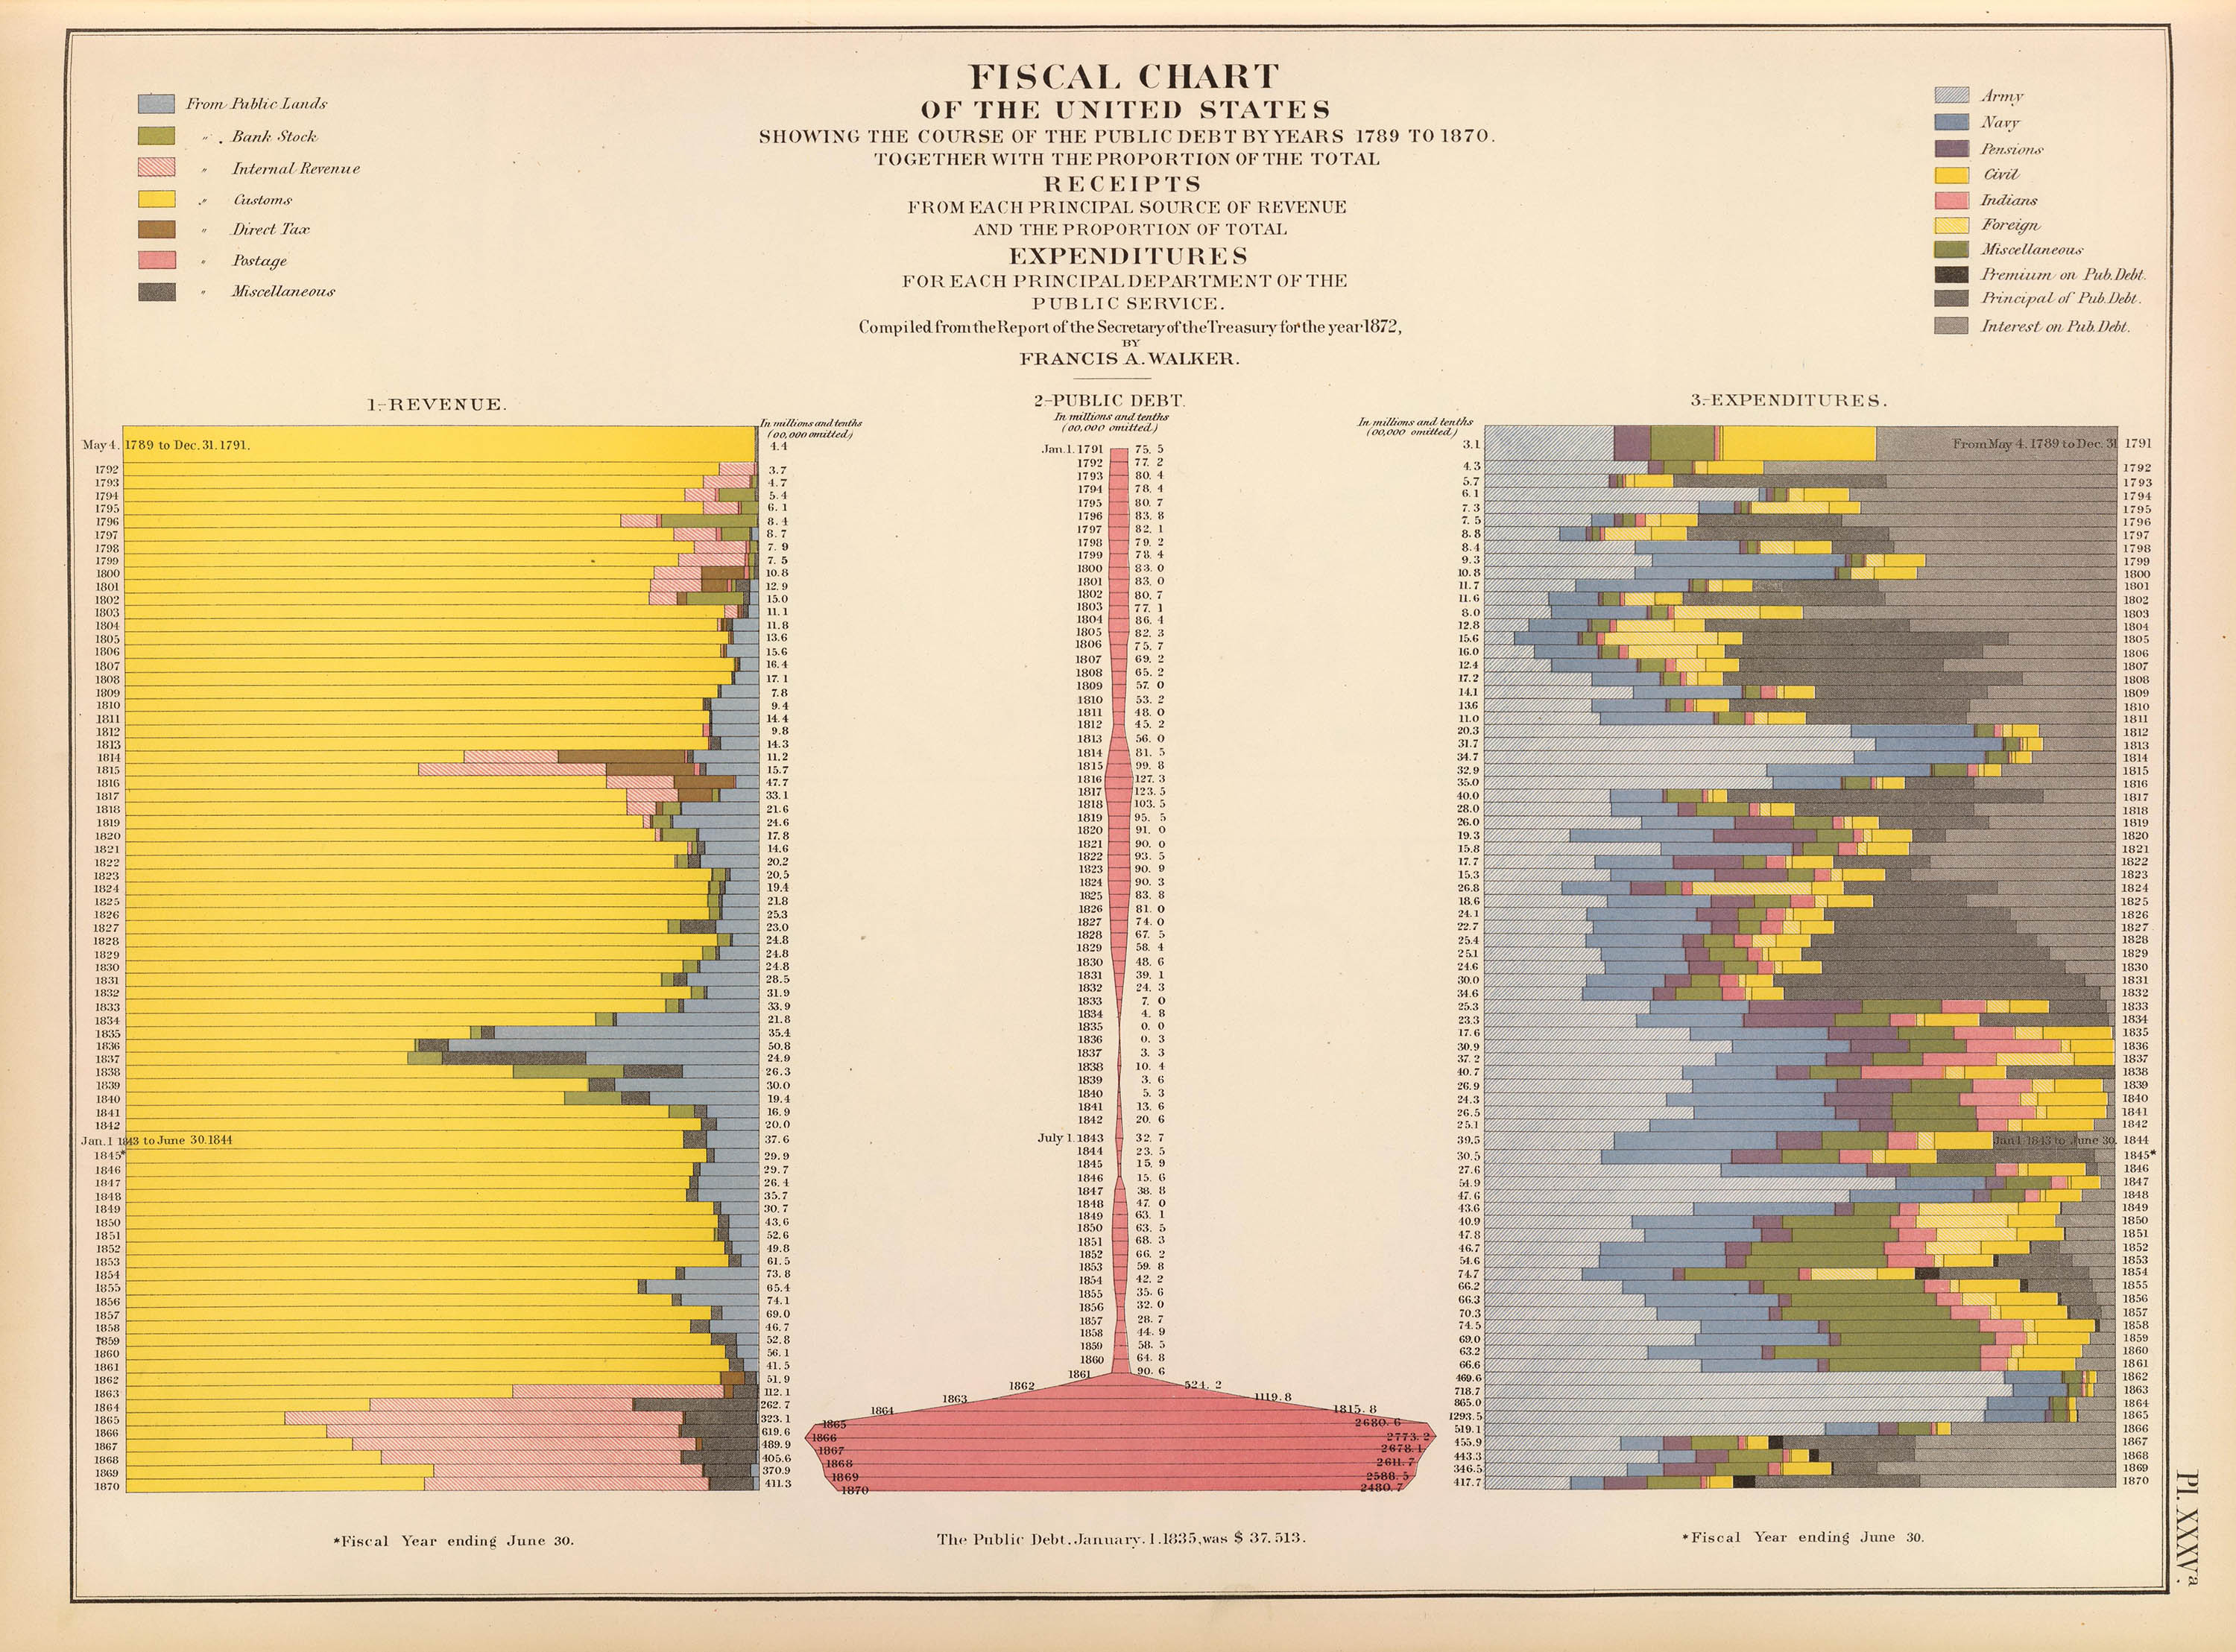
Fiscal Chart
The Atlas, beautifully lithographed by Julius Bien of New York, was published in several sections between Jul – Aug 1874. Walker’s dazzling presentation of maps and charts allowed, for the first time ever, at-a-glance comparisons of Census data on a national level and was widely praised by both cartographers and statisticians. One reviewer called it “a revelation of the capacity of graphic representation.” It was the de facto first National Altas and a watershed in American cartography.4
Walker’s Altas compared favorably to even the best work being done in Europe. It was given a positive review by the Royal Geographical Society and won a Medal of first class at the Paris Geographical Conference of 1875.
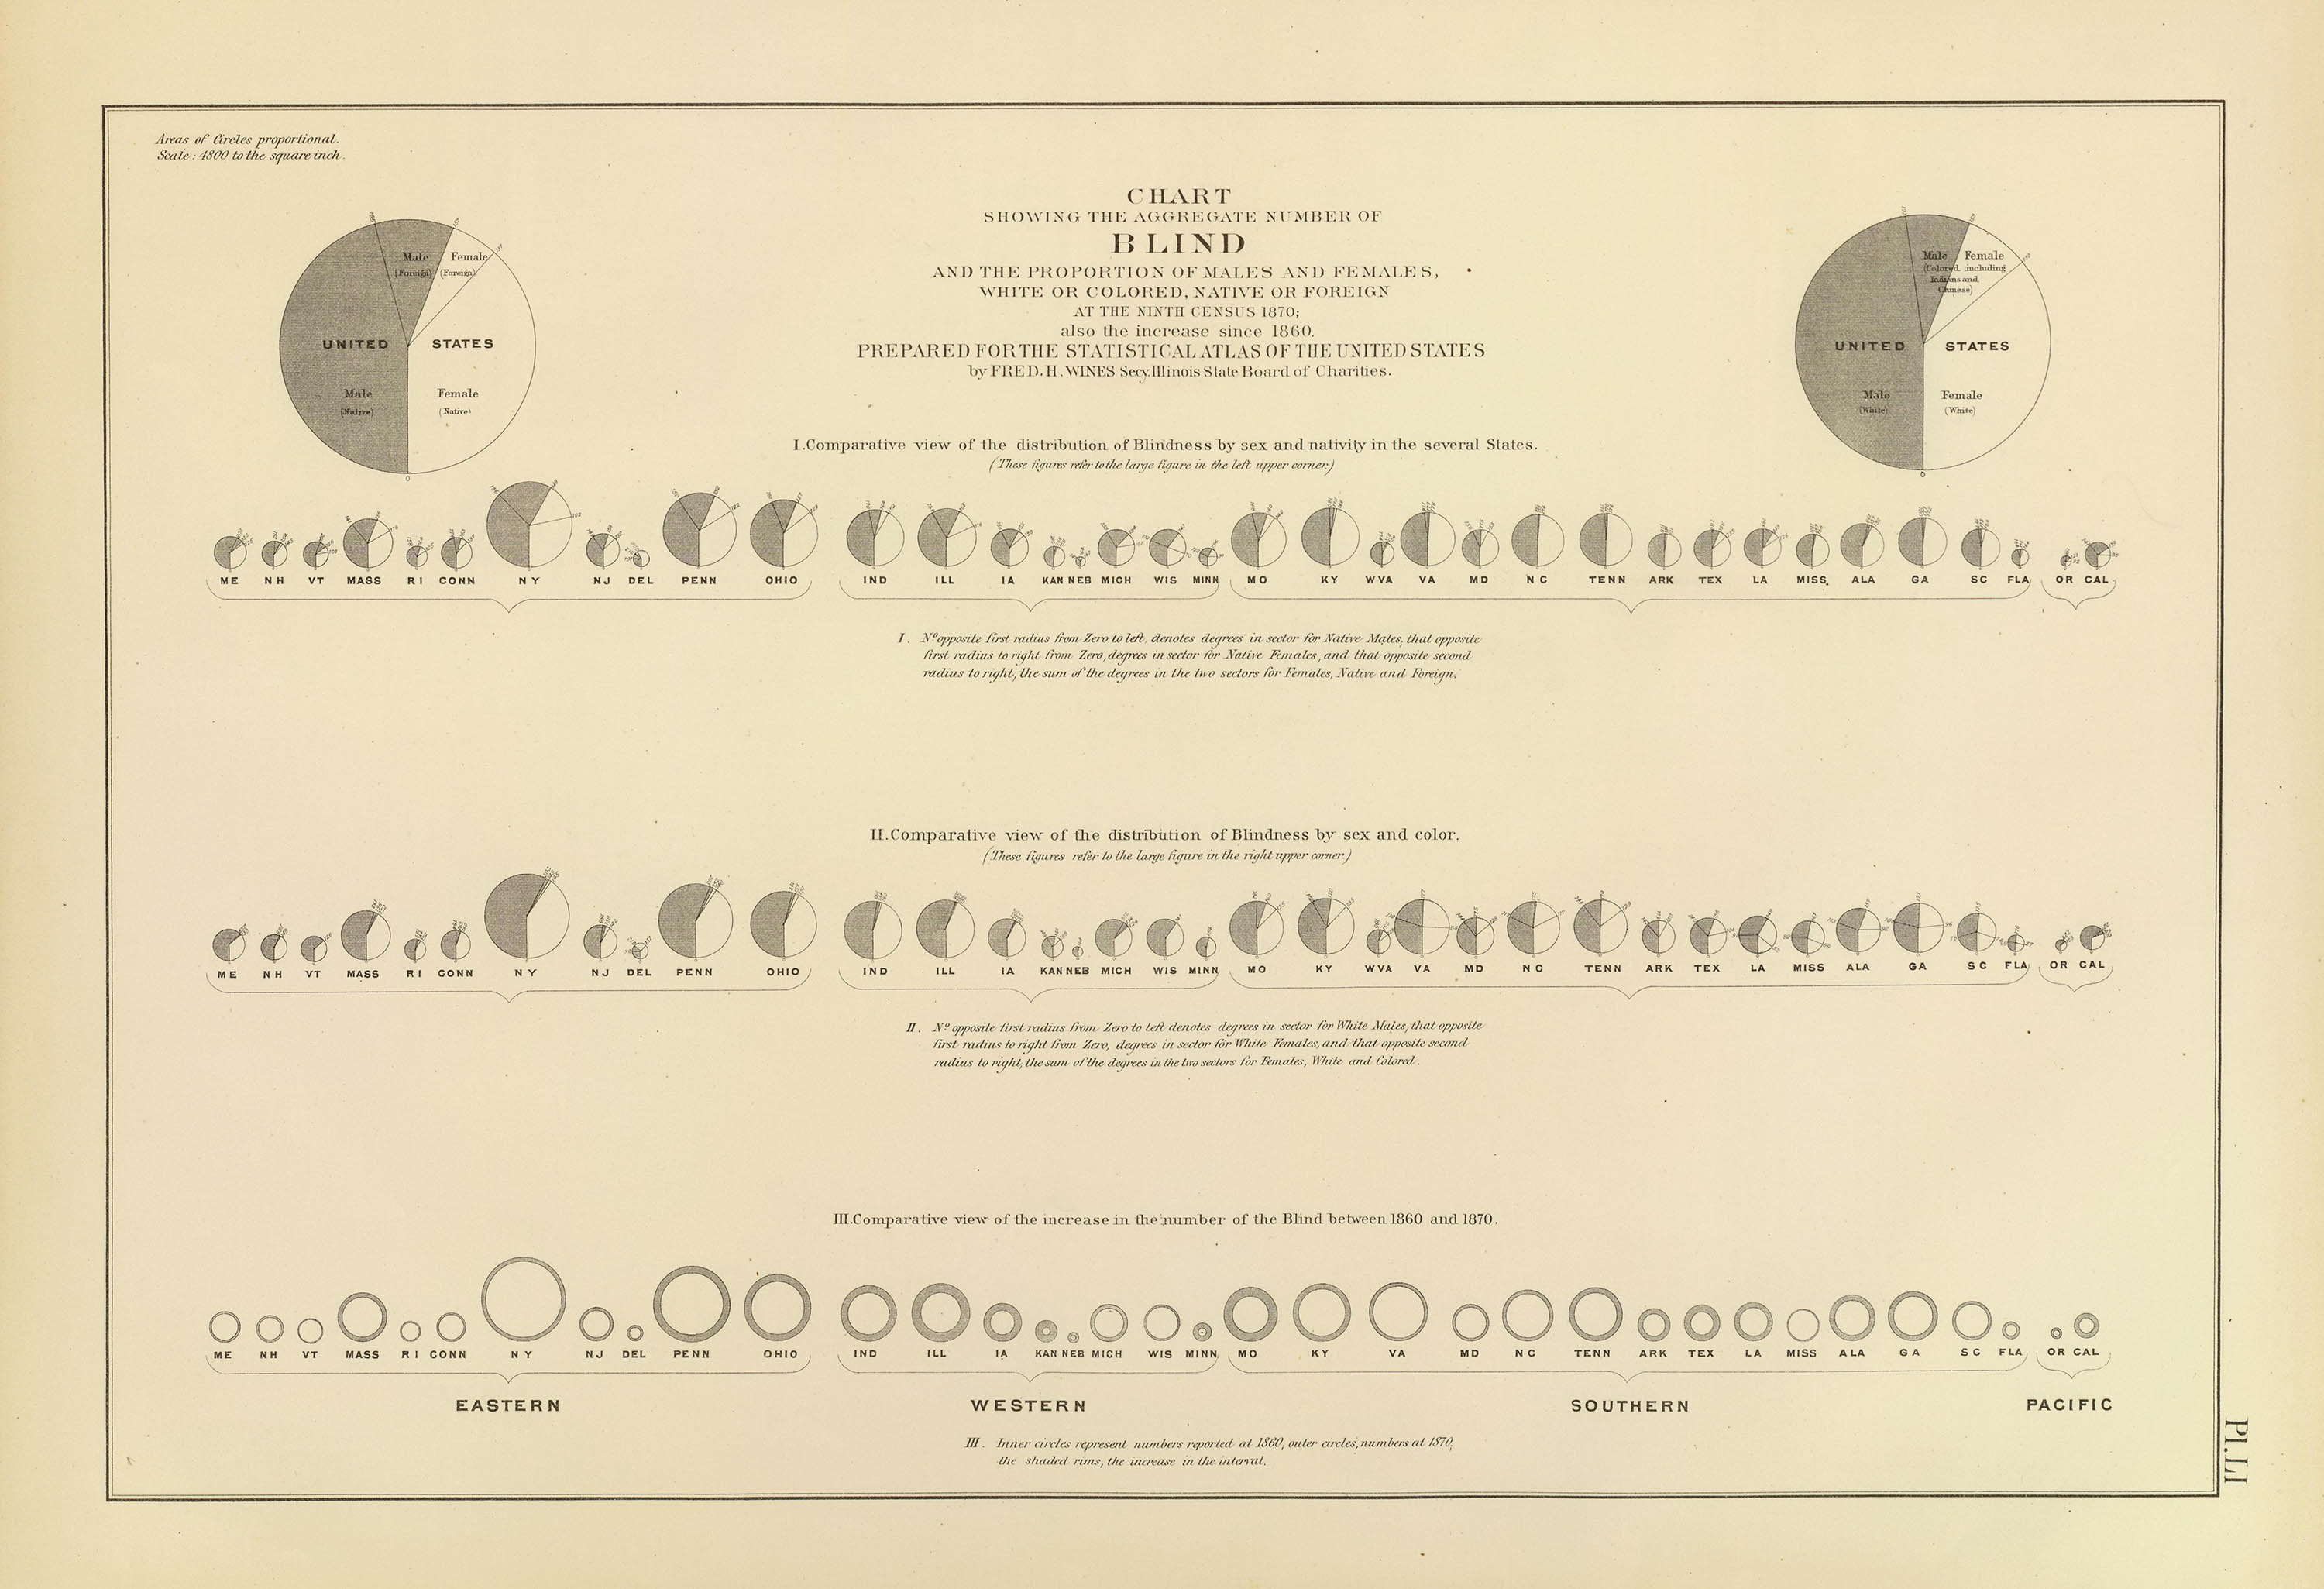
Aggregate Number of Blind
The Altas was beautifully updated under the direction of the the geographer Henry Gannett after the 1880 and 1890 Census.6,7
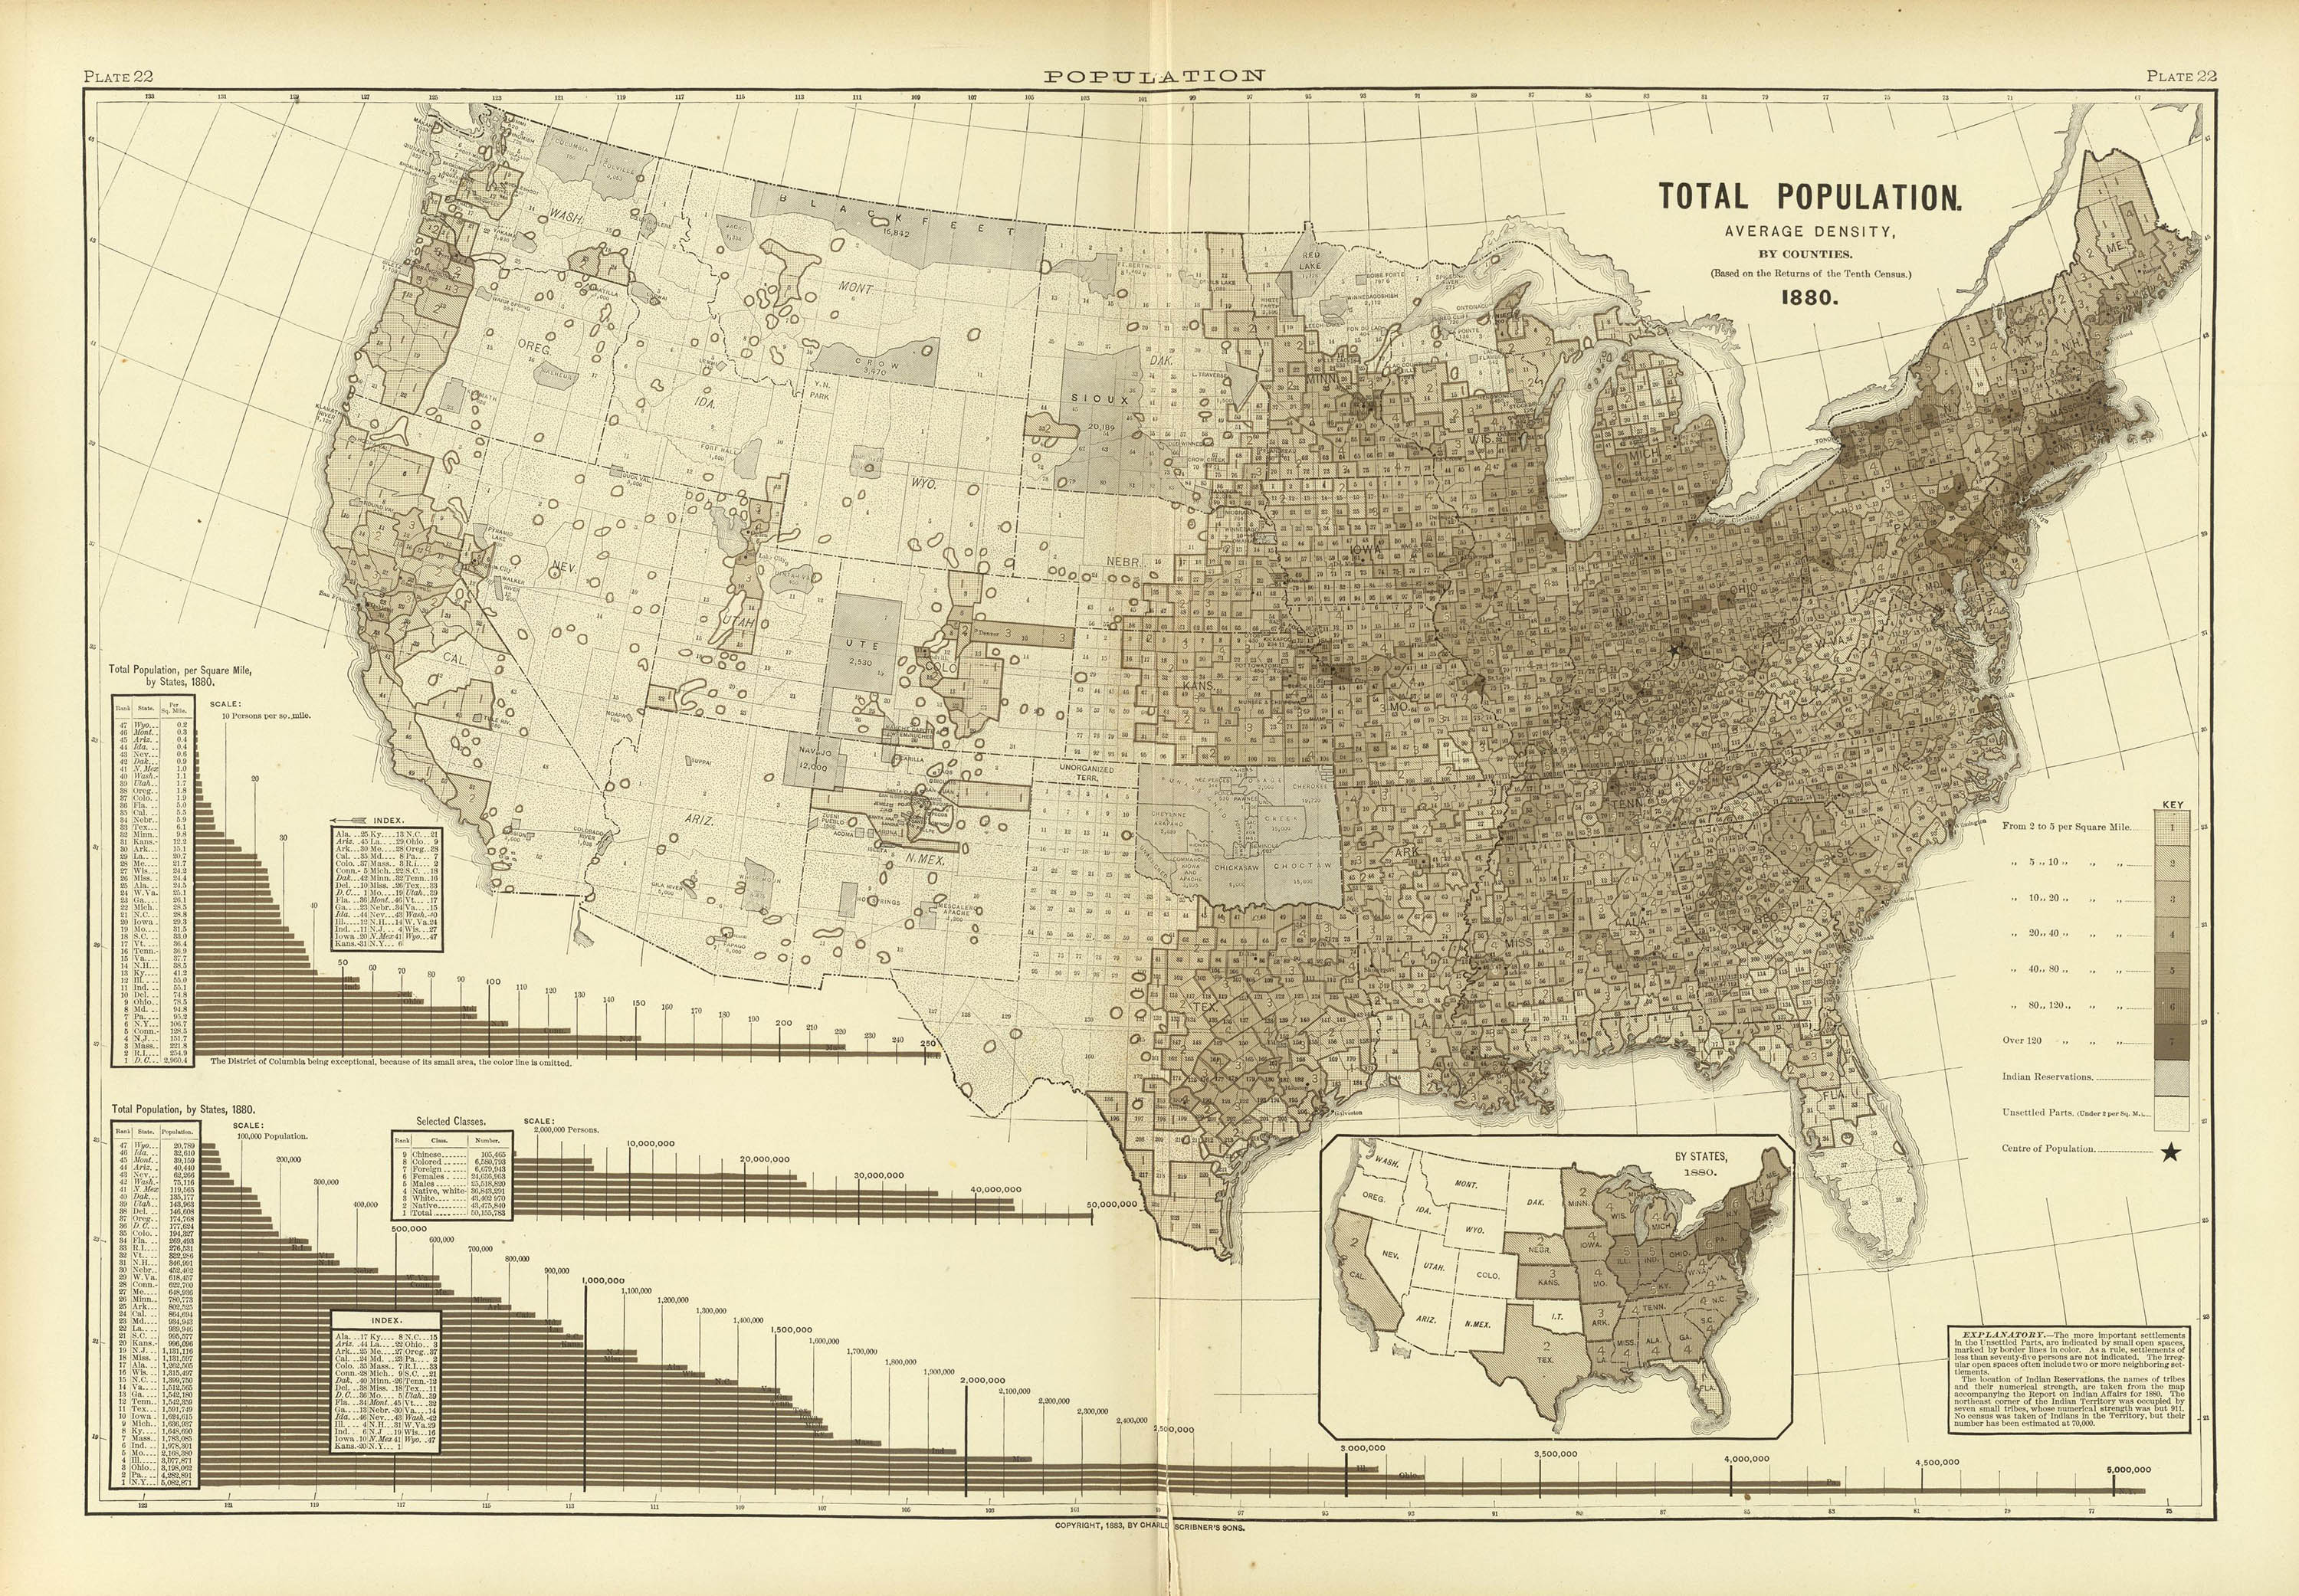
Total Population, 1880
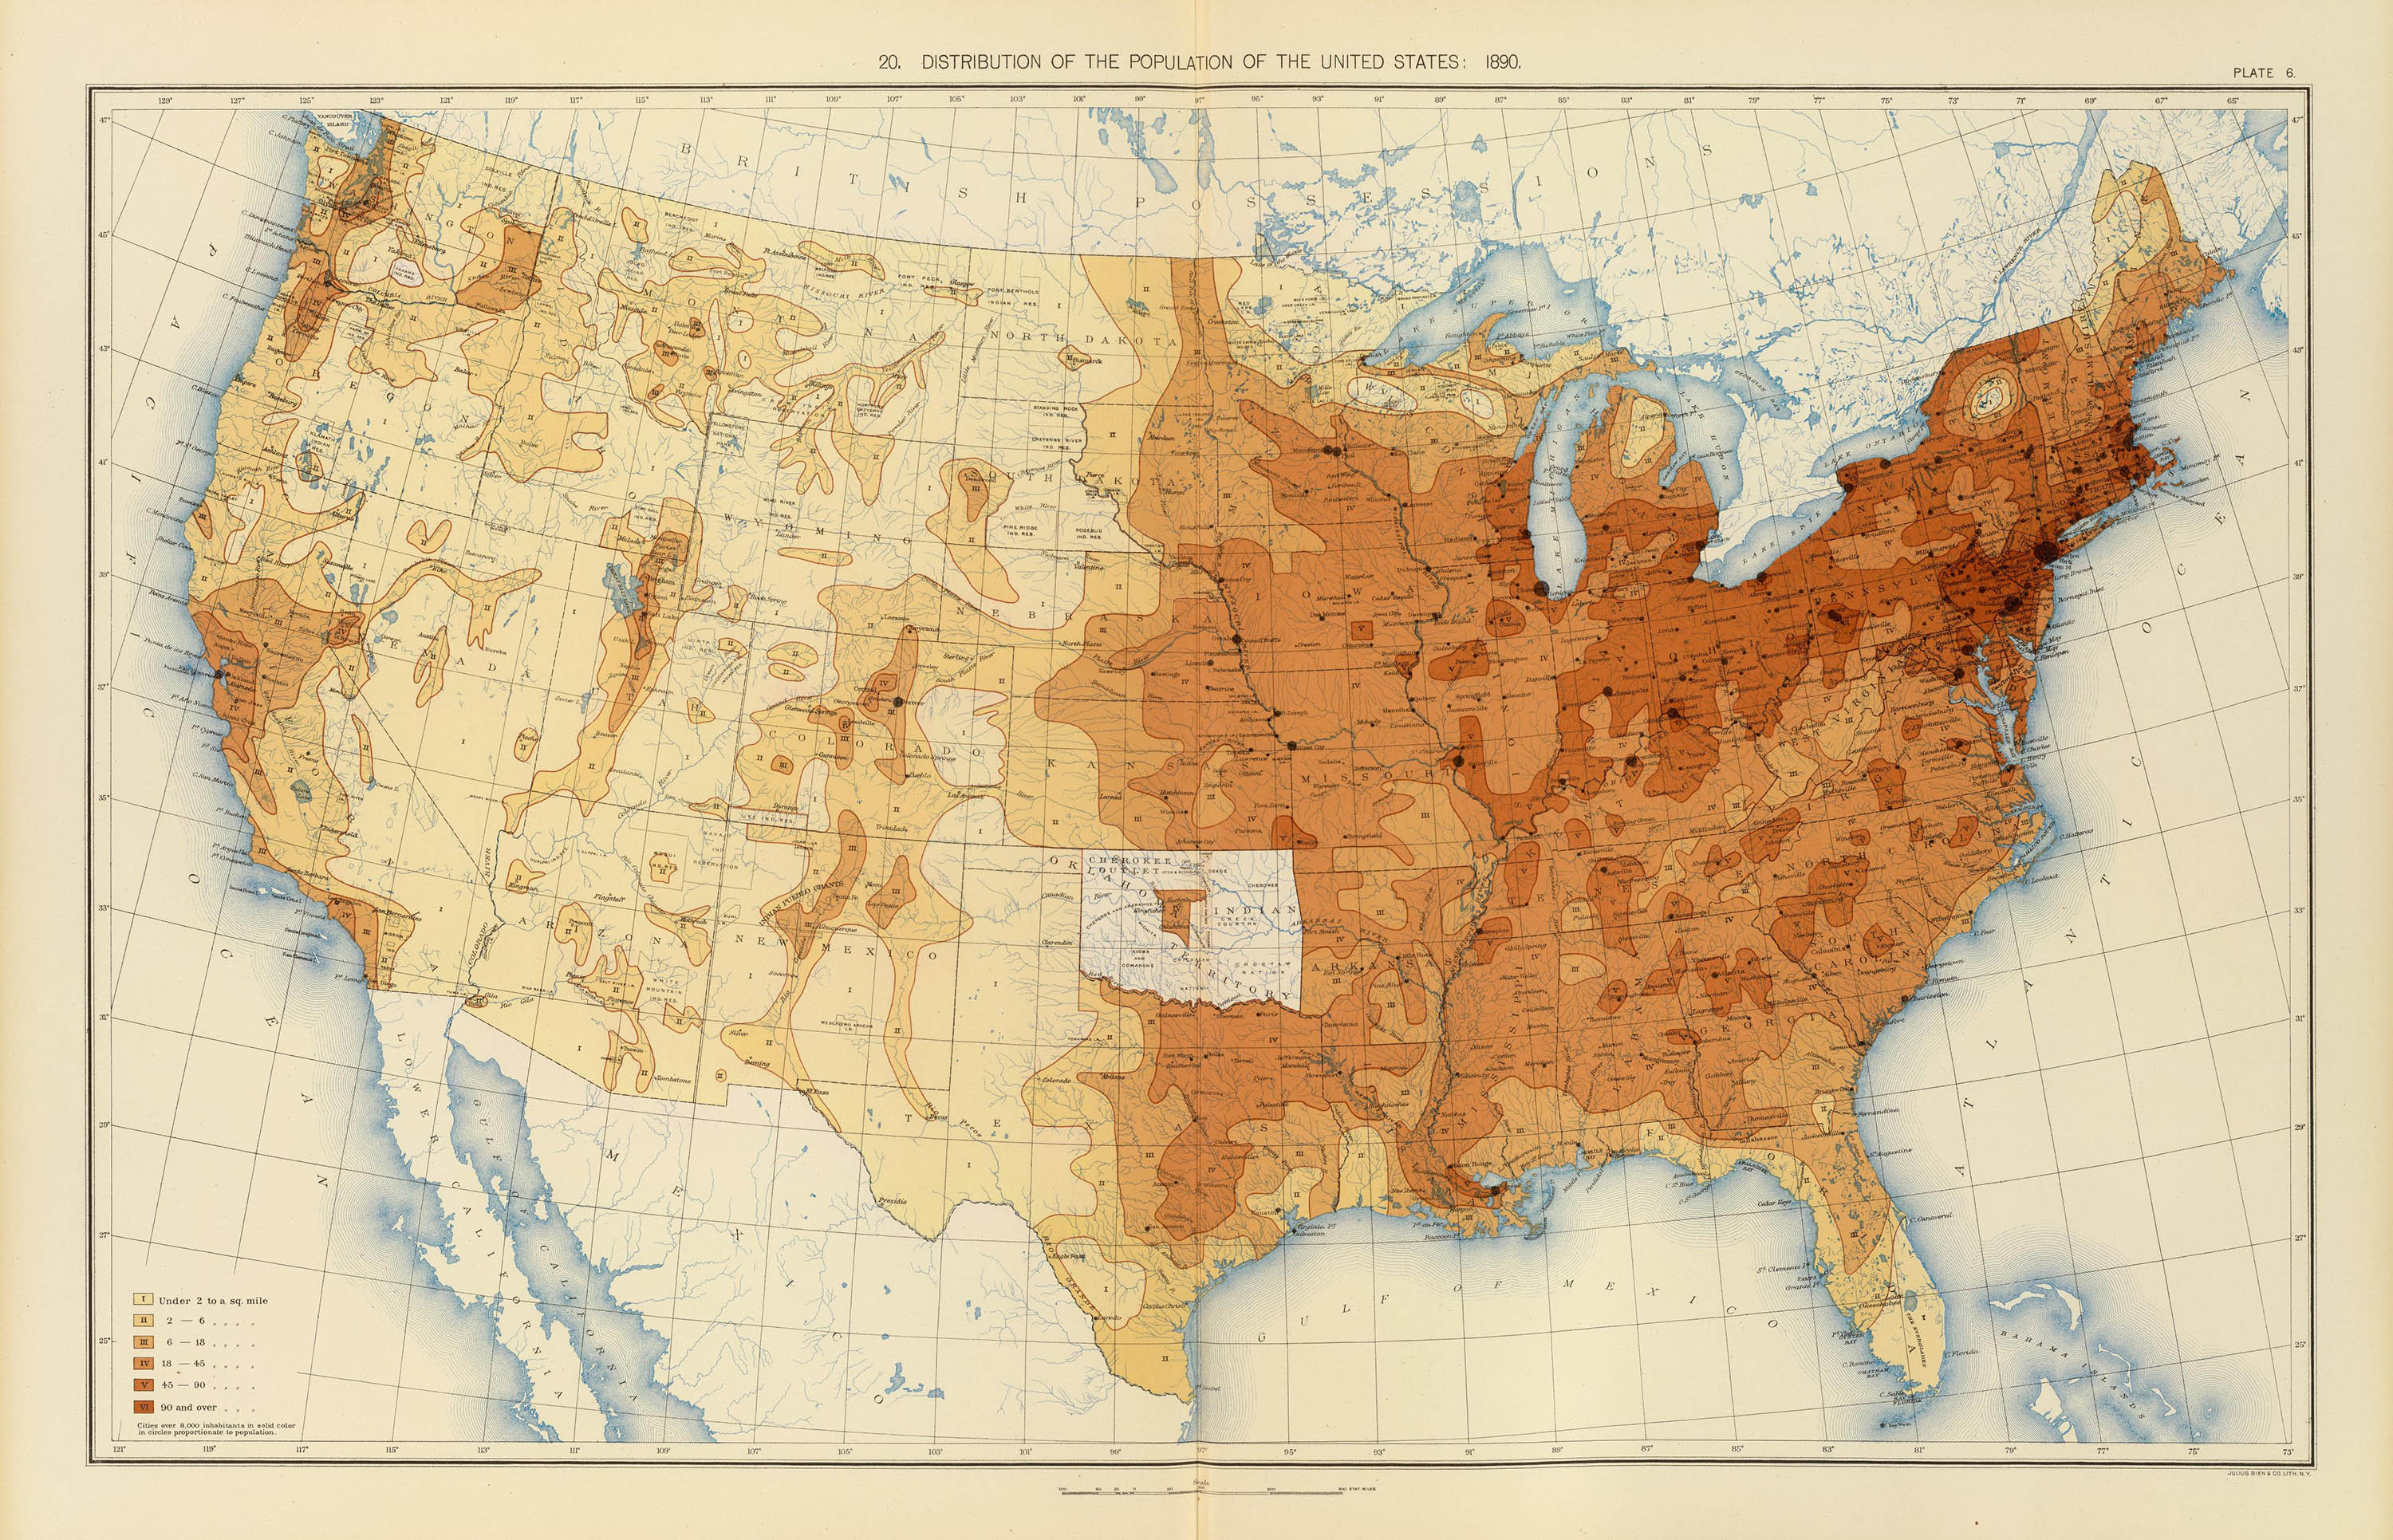
Distribution of Population, 1890
Beginning with the 1900 Census, however, the maps were reduced to quarto size and by 1920 they became unimaginative B&W afterthoughts to the Census report. It would be nearly a century after Walker’s groundbreaking work before the US government revisited the idea of a National Altas (and that’s Pt II).
1. For a complete biography see: Munroe, James P. A Life of Francis Amasa Walker. New York: Henry Holt & Company, 1929.
2. The US Constitution (Art I, Sect 2) empowered Congress to perform a decennial enumeration of the population for the purpose of congressional apportionment. Over the years the Census began to collect more data. The Ninth Census, e.g., had a 18-item field questionnaire:
The reports of the Ninth Census, as well as other official documentation, are available at Census.gov
3. Walker, Francis. Statistical Atlas of the United States Based on the Results of the Ninth Census 1870. New York; Julius Bien, 1874. The large (56 × 24 cm), 120+ page folio included 60 plates and was printed in a single edition of 5000 copies. The Atlas is widely available online in whole or part. The Federal Reserve Fraser archive has the entire LOC copy as a pdf. The plates are available at high resolution at the Rumsey Collection. The images here are from the Rumsey copy.
4. For more about Walker and the Atlas see: Mood, Fulmer. “The Rise of Official Statistical Cartography in Austria, Prussia, and the United States, 1855–1872.” Agricultural History 1946 20: 209–225 (online at Cornell's CHLA server), or Edwards, Ann. Walkers Statistical Atlas and the Development of American Cartography. (Diss. University of Wisconsin, 1969) (online at UW), or Kinnahan, Thomas. “Charting Progress: Francis Amasa Walker’s Statistical Atlas of the United States and Narratives of Western Expansion.” American Quarterly. June 2008 60(2): 399–423.
5. The Ninth Census was the first to properly enumerate the African-American population. The statistical mapping of slavery and slave states, by both American and European cartographers, was a politically-charged, complicated topic. See: Schulten, Susan. “The Cartography of Slavery and the Authority of Statistics.” Civil War History 2010 61(1): 5–33. (online at Project Muse).
6. Hewes, Fletcher, Gannett, Henry. Scribner’s Statistical Atlas of the United States Showing by Graphic Methods their Present Condition and their Political, Social and Industrial Development. New York: Charles Scribner’s Sons, 1883.
7. Gannett, Henry. Statistical Atlas of the United States, Based Upon Results of the Eleventh Census (1890). Washington: Government Printing Office, 1898.
28 Aug 2012 ‧ Cartography